Simple survey creation
Kaufmann, 2022-2024.
[1]:
from geometron.survey import TopoPoint, TopoLine
from geometron.geometries import features_to_gdf
from geometron.geometries import transforms as ggt
from geometron.plot import plot_point, plot_line, plot_profile, plot_gdf_survey, plot_basemap
import matplotlib.pyplot as plt
import pandas as pd
import geopandas as gpd
from shapely.geometry import Point, LineString
import shapely
Create some landmarks in a local coordinate system
Coordinates are planar coordinates
Using wkt
[2]:
L001 = TopoPoint('POINT (0. 0.)', id='L001', kind='landmark')
L002 = TopoPoint('POINT (50. 0.)', id='L002', kind='landmark')
Using shapely geometries
[3]:
L003 = TopoPoint(Point(4., 120.), id='L003', kind='landmark')
L004 = TopoPoint(Point(54., 112.), id='L004', kind='landmark')
Plot L001 in a matplotlib axes
[4]:
L001.plot()
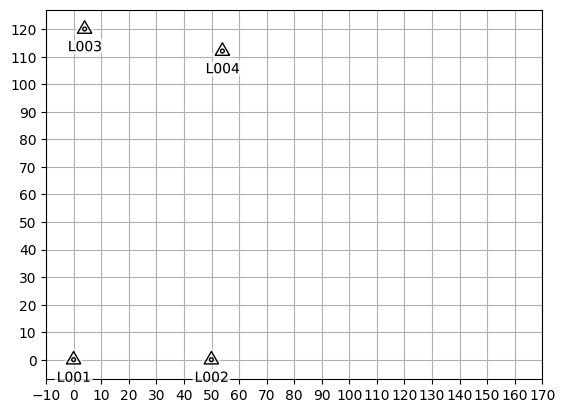
Add the landmarks in a survey geodataframe and display the survey
[5]:
gdf = features_to_gdf([L001, L002, L003, L004])
gdf
[5]:
| geometry | class | kind | label | show_label | |
|---|---|---|---|---|---|
| id | |||||
| L001 | POINT (0 0) | TopoPoint | landmark | L001 | True |
| L002 | POINT (50 0) | TopoPoint | landmark | L002 | True |
| L003 | POINT (4 120) | TopoPoint | landmark | L003 | True |
| L004 | POINT (54 112) | TopoPoint | landmark | L004 | True |
[6]:
ax = plot_gdf_survey(gdf)
square grid step: 10.0
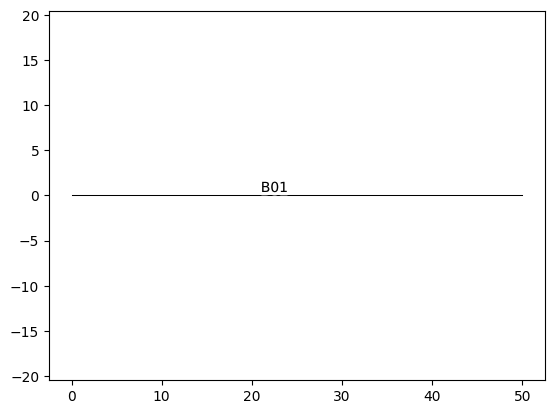
Create a baseline in local coordinates
Baseline B01 joins L001 and L002
[7]:
B01 = TopoLine(LineString([L001.geometry, L002.geometry]), id='B01', kind='baseline', show_label=False)
[8]:
B01.plot()
Baseline B02 joins L003 and L004
[9]:
B02 = TopoLine(LineString([L003.geometry, L004.geometry]), id='B02', kind='baseline', show_label=False)
Append the survey geodataframe
[10]:
gdf = pd.concat([gdf, features_to_gdf([B01, B02])], ignore_index=True)
Display the appended survey
[11]:
plot_gdf_survey(gdf)
square grid step: 10.0
[11]:
<Axes: >

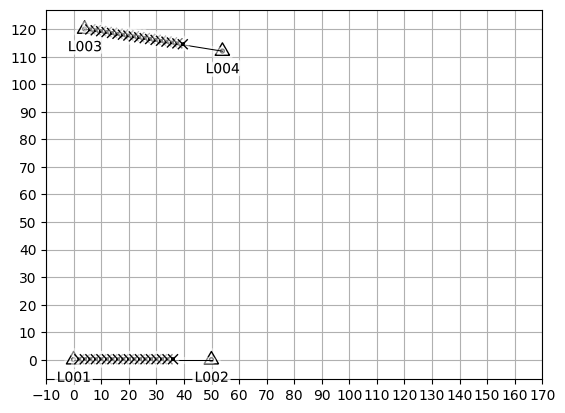
Add 18 meandering profiles starting and ending on the baselines
The distance between the starting and ending points along the baseline is set to 2 meters
[12]:
number_of_profiles = 18
spacing_on_B01 = 2
spacing_on_B02 = 2
Create the stakes where the profiles start and end
[13]:
stakes_B01 = [TopoPoint(Point(B01.geometry.interpolate(i*spacing_on_B01)), id='', kind='stake') for i in range(1, number_of_profiles+1)]
stakes_B02 = [TopoPoint(Point(B02.geometry.interpolate(i*spacing_on_B02)), id='', kind='stake') for i in range(1, number_of_profiles+1)]
Append the survey geodataframe and plot it
[14]:
gdf = pd.concat([gdf, features_to_gdf(stakes_B01), features_to_gdf(stakes_B02)], ignore_index=True)
[15]:
plot_gdf_survey(gdf)
square grid step: 10.0
[15]:
<Axes: >
Create the profiles and append the survey geodataframe
[16]:
profiles = []
for i in range(1,number_of_profiles+1,2):
    profiles.append(TopoLine(LineString([stakes_B01[i-1].geometry, stakes_B02[i-1].geometry]), id=f'P{i:02d}', kind='profile'))
for i in range(2,number_of_profiles+1,2):
    profiles.append(TopoLine(LineString([stakes_B02[i-1].geometry, stakes_B01[i-1].geometry]), id=f'P{i:02d}', kind='profile'))
[17]:
gdf = pd.concat([gdf, features_to_gdf(profiles)], ignore_index=True)
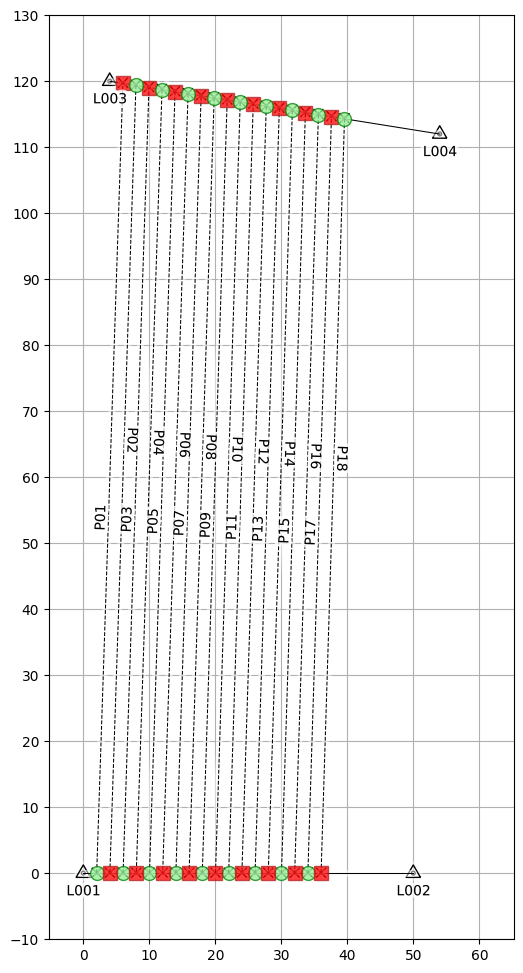
[18]:
fig, ax = plt.subplots(figsize=(6,12))
plot_gdf_survey(gdf, ax=ax)
square grid step: 10.0
[18]:
<Axes: >
Transform from local coordinates to geographic coordinates
Here an affine transform is used. Based on the use case other approaches could be better suited.
Define the control points for the affine transform
[19]:
origin_coords = [L001, L002, L003, L004]
[20]:
landmarks = gpd.read_file('./data/landmarks.shp')
landmarks.set_index('Label', drop=False, inplace=True)
landmarks.crs
[20]:
<Projected CRS: EPSG:3812>
Name: ETRS89 / Belgian Lambert 2008
Axis Info [cartesian]:
- X[east]: Easting (metre)
- Y[north]: Northing (metre)
Area of Use:
- name: Belgium - onshore.
- bounds: (2.5, 49.5, 6.4, 51.51)
Coordinate Operation:
- name: Belgian Lambert 2008
- method: Lambert Conic Conformal (2SP)
Datum: European Terrestrial Reference System 1989 ensemble
- Ellipsoid: GRS 1980
- Prime Meridian: Greenwich
[21]:
destination_coords = [(i.x, i.y) for i in landmarks.loc[['L001', 'L002', 'L003', 'L004'], 'geometry'].values]
Compute the transform matrix
[22]:
matrix, residual, _, _ = ggt.affine_transform_matrix(origin_coords=origin_coords, destination_coords=destination_coords)
[23]:
residual
[23]:
array([1.70078765, 5.30641372])
Save the local coordinates in wkt format in the ‘local_geometry’ column and apply the transform to the survey geodataframe
[24]:
gdf['local_geometry'] = gdf['geometry'].to_wkt()
[25]:
gdf
[25]:
| geometry | class | kind | label | show_label | local_geometry | |
|---|---|---|---|---|---|---|
| 0 | POINT (0 0) | TopoPoint | landmark | L001 | True | POINT (0 0) |
| 1 | POINT (50 0) | TopoPoint | landmark | L002 | True | POINT (50 0) |
| 2 | POINT (4 120) | TopoPoint | landmark | L003 | True | POINT (4 120) |
| 3 | POINT (54 112) | TopoPoint | landmark | L004 | True | POINT (54 112) |
| 4 | LINESTRING (0 0, 50 0) | TopoLine | baseline | B01 | False | LINESTRING (0 0, 50 0) |
| 5 | LINESTRING (4 120, 54 112) | TopoLine | baseline | B02 | False | LINESTRING (4 120, 54 112) |
| 6 | POINT (2 0) | TopoPoint | stake | True | POINT (2 0) | |
| 7 | POINT (4 0) | TopoPoint | stake | True | POINT (4 0) | |
| 8 | POINT (6 0) | TopoPoint | stake | True | POINT (6 0) | |
| 9 | POINT (8 0) | TopoPoint | stake | True | POINT (8 0) | |
| 10 | POINT (10 0) | TopoPoint | stake | True | POINT (10 0) | |
| 11 | POINT (12 0) | TopoPoint | stake | True | POINT (12 0) | |
| 12 | POINT (14 0) | TopoPoint | stake | True | POINT (14 0) | |
| 13 | POINT (16 0) | TopoPoint | stake | True | POINT (16 0) | |
| 14 | POINT (18 0) | TopoPoint | stake | True | POINT (18 0) | |
| 15 | POINT (20 0) | TopoPoint | stake | True | POINT (20 0) | |
| 16 | POINT (22 0) | TopoPoint | stake | True | POINT (22 0) | |
| 17 | POINT (24 0) | TopoPoint | stake | True | POINT (24 0) | |
| 18 | POINT (26 0) | TopoPoint | stake | True | POINT (26 0) | |
| 19 | POINT (28 0) | TopoPoint | stake | True | POINT (28 0) | |
| 20 | POINT (30 0) | TopoPoint | stake | True | POINT (30 0) | |
| 21 | POINT (32 0) | TopoPoint | stake | True | POINT (32 0) | |
| 22 | POINT (34 0) | TopoPoint | stake | True | POINT (34 0) | |
| 23 | POINT (36 0) | TopoPoint | stake | True | POINT (36 0) | |
| 24 | POINT (5.975 119.684) | TopoPoint | stake | True | POINT (5.974881 119.684019) | |
| 25 | POINT (7.95 119.368) | TopoPoint | stake | True | POINT (7.949763 119.368038) | |
| 26 | POINT (9.925 119.052) | TopoPoint | stake | True | POINT (9.924644 119.052057) | |
| 27 | POINT (11.9 118.736) | TopoPoint | stake | True | POINT (11.899525 118.736076) | |
| 28 | POINT (13.874 118.42) | TopoPoint | stake | True | POINT (13.874406 118.420095) | |
| 29 | POINT (15.849 118.104) | TopoPoint | stake | True | POINT (15.849288 118.104114) | |
| 30 | POINT (17.824 117.788) | TopoPoint | stake | True | POINT (17.824169 117.788133) | |
| 31 | POINT (19.799 117.472) | TopoPoint | stake | True | POINT (19.79905 117.472152) | |
| 32 | POINT (21.774 117.156) | TopoPoint | stake | True | POINT (21.773931 117.156171) | |
| 33 | POINT (23.749 116.84) | TopoPoint | stake | True | POINT (23.748813 116.84019) | |
| 34 | POINT (25.724 116.524) | TopoPoint | stake | True | POINT (25.723694 116.524209) | |
| 35 | POINT (27.699 116.208) | TopoPoint | stake | True | POINT (27.698575 116.208228) | |
| 36 | POINT (29.673 115.892) | TopoPoint | stake | True | POINT (29.673456 115.892247) | |
| 37 | POINT (31.648 115.576) | TopoPoint | stake | True | POINT (31.648338 115.576266) | |
| 38 | POINT (33.623 115.26) | TopoPoint | stake | True | POINT (33.623219 115.260285) | |
| 39 | POINT (35.598 114.944) | TopoPoint | stake | True | POINT (35.5981 114.944304) | |
| 40 | POINT (37.573 114.628) | TopoPoint | stake | True | POINT (37.572981 114.628323) | |
| 41 | POINT (39.548 114.312) | TopoPoint | stake | True | POINT (39.547863 114.312342) | |
| 42 | LINESTRING (2 0, 5.975 119.684) | TopoLine | profile | P01 | True | LINESTRING (2 0, 5.974881 119.684019) |
| 43 | LINESTRING (6 0, 9.925 119.052) | TopoLine | profile | P03 | True | LINESTRING (6 0, 9.924644 119.052057) |
| 44 | LINESTRING (10 0, 13.874 118.42) | TopoLine | profile | P05 | True | LINESTRING (10 0, 13.874406 118.420095) |
| 45 | LINESTRING (14 0, 17.824 117.788) | TopoLine | profile | P07 | True | LINESTRING (14 0, 17.824169 117.788133) |
| 46 | LINESTRING (18 0, 21.774 117.156) | TopoLine | profile | P09 | True | LINESTRING (18 0, 21.773931 117.156171) |
| 47 | LINESTRING (22 0, 25.724 116.524) | TopoLine | profile | P11 | True | LINESTRING (22 0, 25.723694 116.524209) |
| 48 | LINESTRING (26 0, 29.673 115.892) | TopoLine | profile | P13 | True | LINESTRING (26 0, 29.673456 115.892247) |
| 49 | LINESTRING (30 0, 33.623 115.26) | TopoLine | profile | P15 | True | LINESTRING (30 0, 33.623219 115.260285) |
| 50 | LINESTRING (34 0, 37.573 114.628) | TopoLine | profile | P17 | True | LINESTRING (34 0, 37.572981 114.628323) |
| 51 | LINESTRING (7.95 119.368, 4 0) | TopoLine | profile | P02 | True | LINESTRING (7.949763 119.368038, 4 0) |
| 52 | LINESTRING (11.9 118.736, 8 0) | TopoLine | profile | P04 | True | LINESTRING (11.899525 118.736076, 8 0) |
| 53 | LINESTRING (15.849 118.104, 12 0) | TopoLine | profile | P06 | True | LINESTRING (15.849288 118.104114, 12 0) |
| 54 | LINESTRING (19.799 117.472, 16 0) | TopoLine | profile | P08 | True | LINESTRING (19.79905 117.472152, 16 0) |
| 55 | LINESTRING (23.749 116.84, 20 0) | TopoLine | profile | P10 | True | LINESTRING (23.748813 116.84019, 20 0) |
| 56 | LINESTRING (27.699 116.208, 24 0) | TopoLine | profile | P12 | True | LINESTRING (27.698575 116.208228, 24 0) |
| 57 | LINESTRING (31.648 115.576, 28 0) | TopoLine | profile | P14 | True | LINESTRING (31.648338 115.576266, 28 0) |
| 58 | LINESTRING (35.598 114.944, 32 0) | TopoLine | profile | P16 | True | LINESTRING (35.5981 114.944304, 32 0) |
| 59 | LINESTRING (39.548 114.312, 36 0) | TopoLine | profile | P18 | True | LINESTRING (39.547863 114.312342, 36 0) |
[26]:
gdf['geometry'] = gpd.GeoSeries.from_wkt(gdf['local_geometry']).affine_transform(matrix)
gdf.crs = landmarks.crs
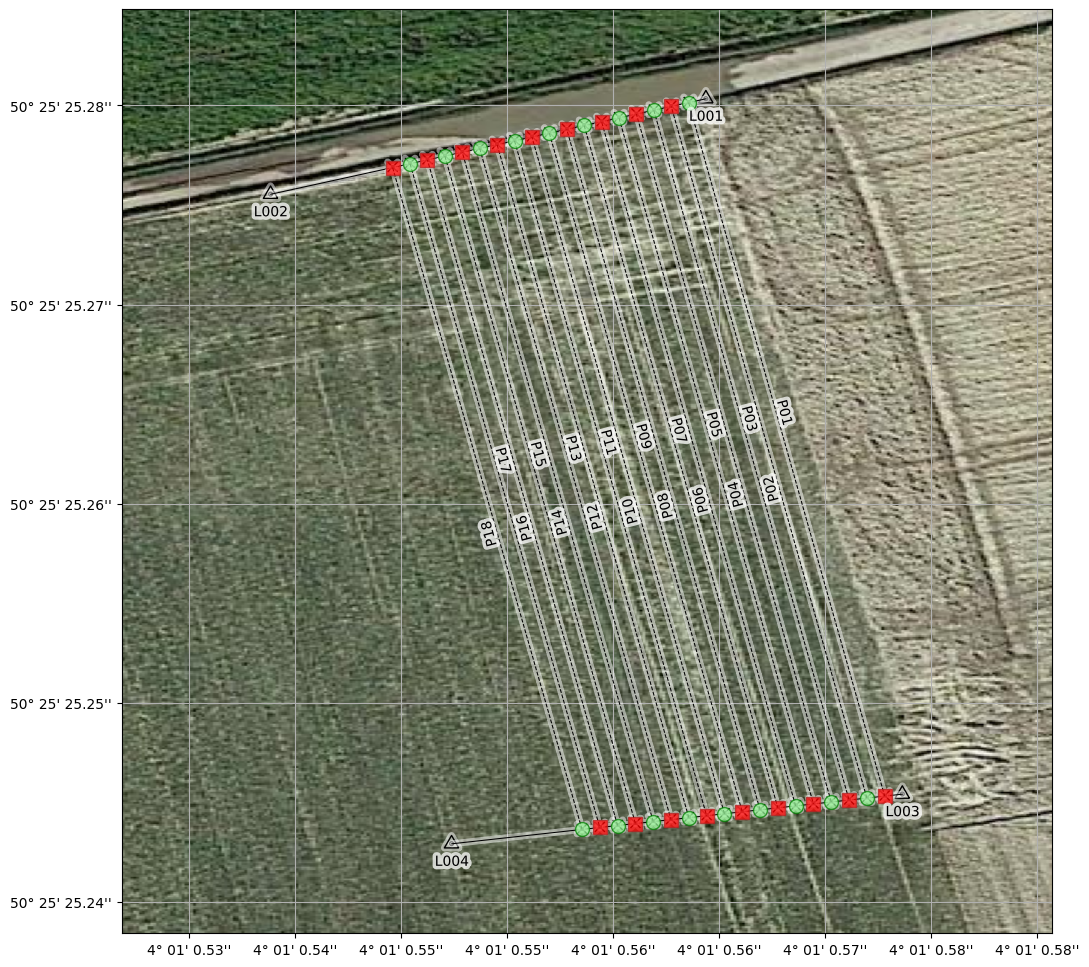
Plot the transformed survey on a basemap
NOTE:
The survey geodataframe should be converted to WGS84 (epsg:4326) for display over a basemap created with geometron.plot.plot_basemap.
It should be located entirely within the extent of the basemap
Compute the extent of the map using a buffer around the survey geodataframe
[27]:
extent = gdf.buffer(10).to_crs('epsg:4326').total_bounds[[0,2,1,3]]
[28]:
cache_dir = './tmp_files/.tiles_cache'
Plot the basemap and the survey geodataframe
[29]:
ax = plot_basemap(extent, figsize=(12,12), xyz_server='google terrain', cache_dir=cache_dir, max_zoom=19)
plot_gdf_survey(gdf.to_crs('epsg:4326'), ax=ax, extent=extent, grid='off')
[29]:
<Axes: >
Export the survey geodataframe to a geopackage
[30]:
gdf.to_file('./tmp_files/survey.gpkg', driver='GPKG')