Plot a 2D seismic layout
Kaufmann, 2022.
[1]:
from geometron.survey import TopoPoint
from geometron.geometries import features_to_gdf
from geometron.plot import plot_gdf_survey
import matplotlib.pyplot as plt
from shapely.geometry import Point
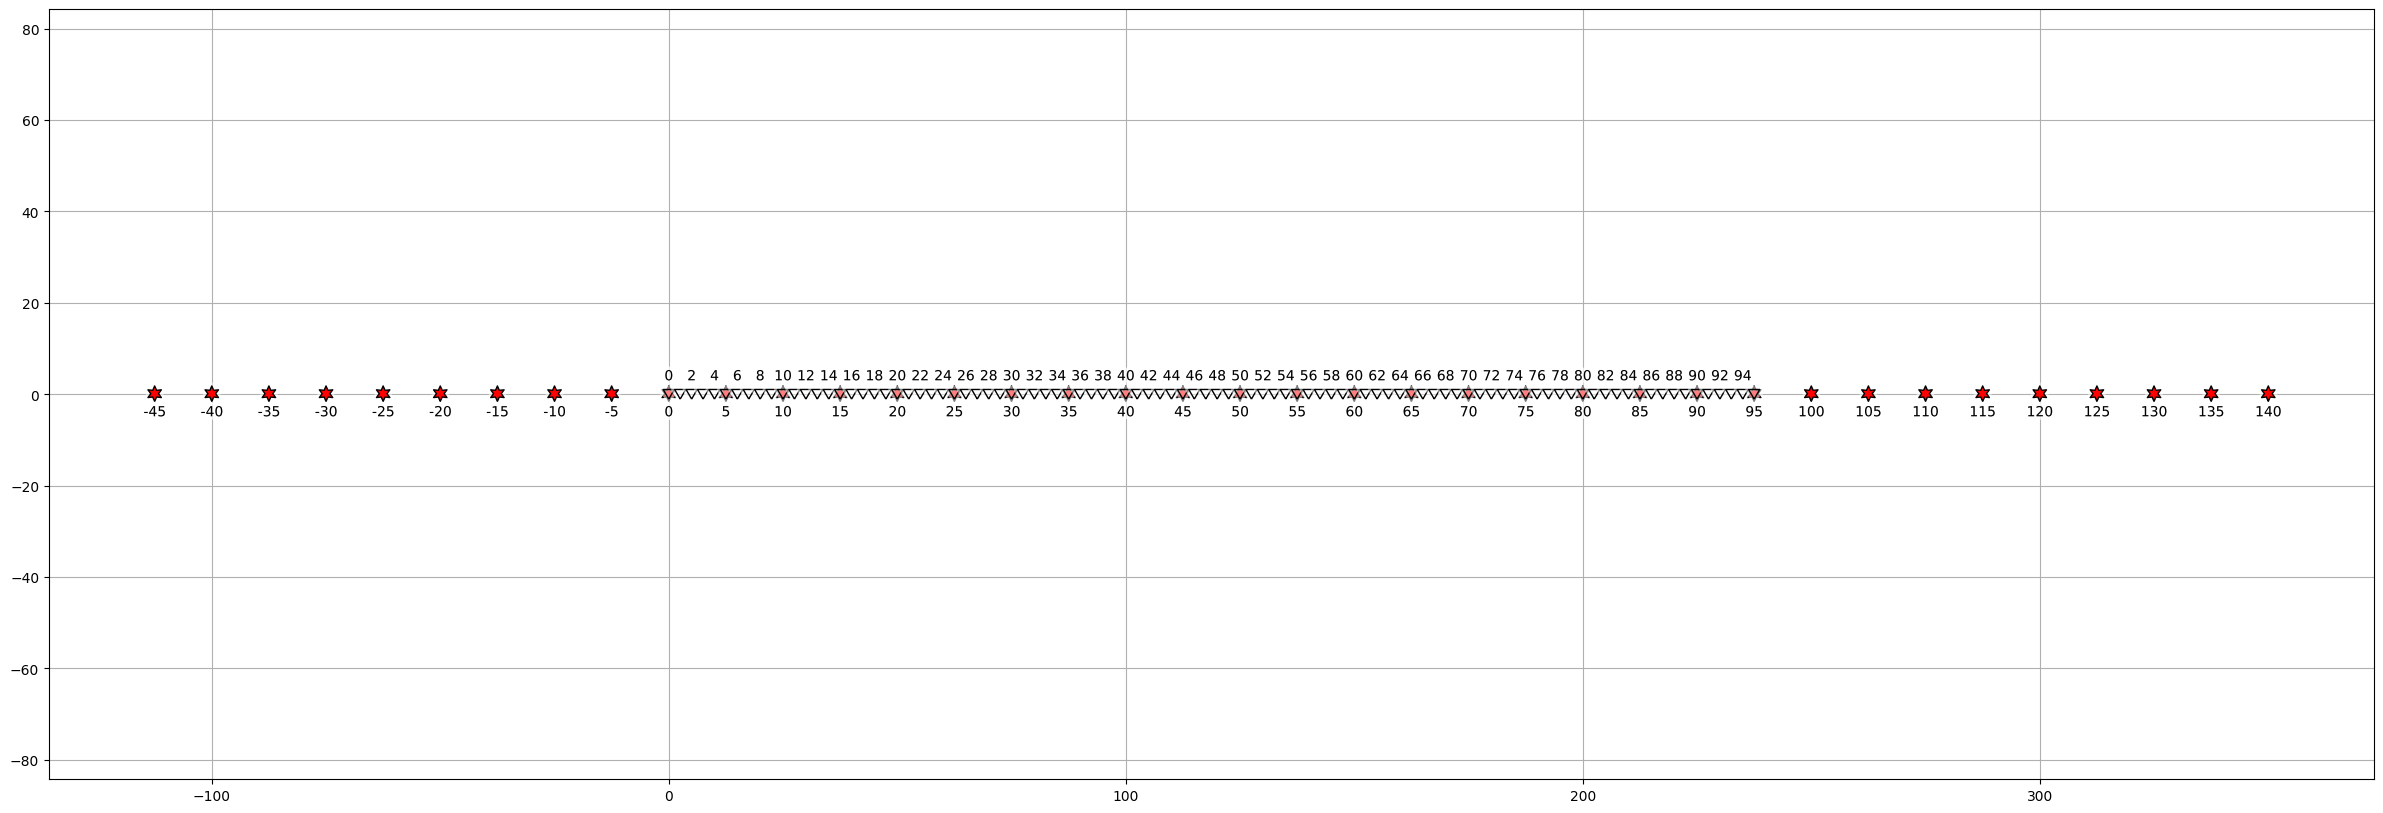
The layout consists of 96 geophones with a spacing of 2.5m. The first geophone is at station 0.
The spacing between shot points is 12.5 m. The first shot is at station -45 and the mast one is at station 140.
Create shots using the station as name
[2]:
shots = [TopoPoint(Point(i*2.5,0), id=f'{i}', kind='shot') for i in range(-45, 145, 5)]
Create geophones using the station as name every two geophones
[3]:
geophones = [TopoPoint(Point(i*2.5,0), id=f'{i}' if i%2 == 0 else '', kind='geophone') for i in range(0, 96)]
Create the layout
[4]:
layout = shots
layout.extend(geophones)
Convert the features in the layout into a geodataframe
[5]:
gdf_layout = features_to_gdf(layout)
gdf_layout.head()
[5]:
| geometry | class | kind | label | show_label | |
|---|---|---|---|---|---|
| id | |||||
| -45 | POINT (-112.5 0) | TopoPoint | shot | -45 | True |
| -40 | POINT (-100 0) | TopoPoint | shot | -40 | True |
| -35 | POINT (-87.5 0) | TopoPoint | shot | -35 | True |
| -30 | POINT (-75 0) | TopoPoint | shot | -30 | True |
| -25 | POINT (-62.5 0) | TopoPoint | shot | -25 | True |
Plot the layout
[6]:
fig, ax = plt.subplots(figsize=(30,10))
plot_gdf_survey(gdf_layout, ax=ax);