Import and display symbols used for reporting field work
Kaufmann, 2022.
[1]:
import matplotlib.pyplot as plt
from geometron.plot import symbols
[2]:
symbols['stake']
[2]:
{'marker': Path(array([[-6.24790884,  7.01052446],
        [ 6.33508116, -5.57246554],
        [ 6.33508116, -5.57246554],
        [ 6.33508116, -5.57246554],
        [ 6.33508116,  7.01052446],
        [-6.24790884, -5.57246454],
        [-6.24790884, -5.57246454],
        [-6.24790884, -5.57246454],
        [-1.48190354,  0.71902746],
        [-1.48190354,  0.71902746],
        [-1.48190354,  0.31459787],
        [-1.32107315, -0.07368104],
        [-1.03509824, -0.35965595],
        [-0.74912334, -0.64563085],
        [-0.36084443, -0.80646124],
        [ 0.04358516, -0.80646124],
        [ 0.44801475, -0.80646124],
        [ 0.83629366, -0.64563085],
        [ 1.12226857, -0.35965595],
        [ 1.40824347, -0.07368104],
        [ 1.56907386,  0.31459787],
        [ 1.56907386,  0.71902746],
        [ 1.56907386,  0.71902746],
        [ 1.56907386,  1.12345705],
        [ 1.40824347,  1.51173596],
        [ 1.12226857,  1.79771086],
        [ 0.83629366,  2.08368577],
        [ 0.44801475,  2.24451616],
        [ 0.04358516,  2.24451616],
        [-0.36084443,  2.24451616],
        [-0.74912334,  2.08368577],
        [-1.03509824,  1.79771086],
        [-1.32107315,  1.51173596],
        [-1.48190354,  1.12345705],
        [-1.48190354,  0.71902746]]), array([1, 4, 4, 4, 1, 4, 4, 4, 1, 2, 4, 4, 4, 4, 4, 4, 4, 4, 4, 4, 4, 4,
        2, 4, 4, 4, 4, 4, 4, 4, 4, 4, 4, 4, 4], dtype=uint8)),
 'alpha': 1.0,
 'markerfacecolor': 'none',
 'markeredgecolor': 'black',
 'markersize': 8}
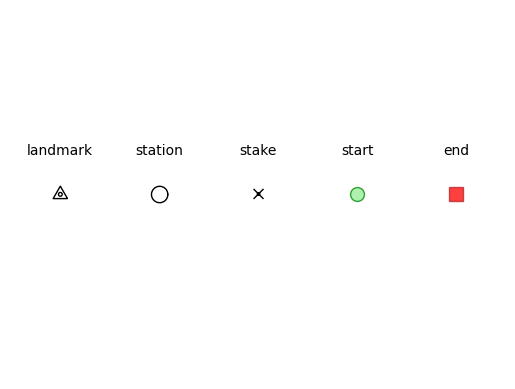
[3]:
fig, ax = plt.subplots()
ax.text(0, 1, 'landmark', va='bottom', ha='center')
ax.plot(0, 0, **symbols['landmark'])
ax.text(10, 1, 'station', va='bottom', ha='center')
ax.plot(10, 0, **symbols['station'])
ax.text(20, 1, 'stake', va='bottom', ha='center')
ax.plot(20, 0, **symbols['stake'])
ax.text(30, 1, 'start', va='bottom', ha='center')
ax.plot(30, 0, **symbols['start'])
ax.text(40, 1, 'end', va='bottom', ha='center')
ax.plot(40, 0, **symbols['end'])
ax.set_xlim(-5, 45)
ax.set_ylim(-5, 5)
ax.axis('off');