2D interpolation example
Kaufmann, 2020 - 2022.
[1]:
import numpy as np
import matplotlib.pyplot as plt
import pandas as pd
import geopandas as gpd
from geometron.interpolation import interpolate_xyv
from shapely.geometry import Point
Read the dataset, create a geodataframe and display it
[2]:
df = pd.read_csv('./data/XYV_example_dataset.csv', sep='\t')
geometry = [Point(xy) for xy in zip(df.Easting, df.Northing)]
crs = 'epsg:31370'
gdf = gpd.GeoDataFrame(df, crs=crs, geometry=geometry)
gdf=gdf.query('Elevation==Elevation') # remove nan values
[3]:
gdf.head()
[3]:
| Unnamed: 0 | Easting | Northing | Elevation | geometry | |
|---|---|---|---|---|---|
| 0 | 1 | 168659.106047 | 104327.904232 | 268.095 | POINT (168659.106 104327.904) |
| 1 | 2 | 168659.116345 | 104328.084830 | 268.106 | POINT (168659.116 104328.085) |
| 2 | 3 | 168659.290645 | 104328.006288 | 268.125 | POINT (168659.291 104328.006) |
| 3 | 4 | 168659.330225 | 104328.074277 | 268.104 | POINT (168659.33 104328.074) |
| 4 | 5 | 168659.379590 | 104328.098180 | 268.116 | POINT (168659.38 104328.098) |
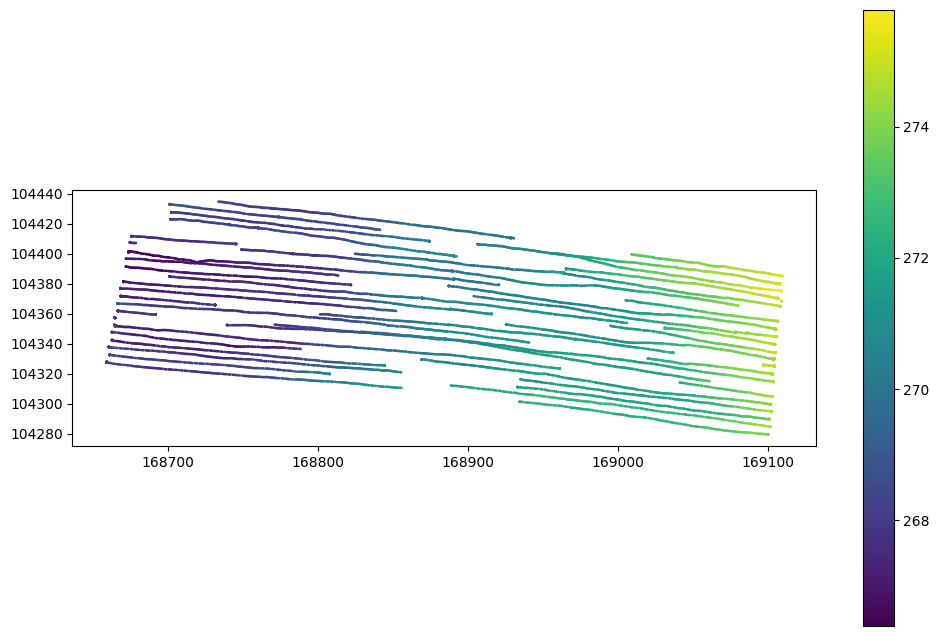
[4]:
fig, ax = plt.subplots(figsize=(12,8))
gdf.plot(ax=ax, column='Elevation', markersize=0.75, legend=True)
[4]:
<Axes: >
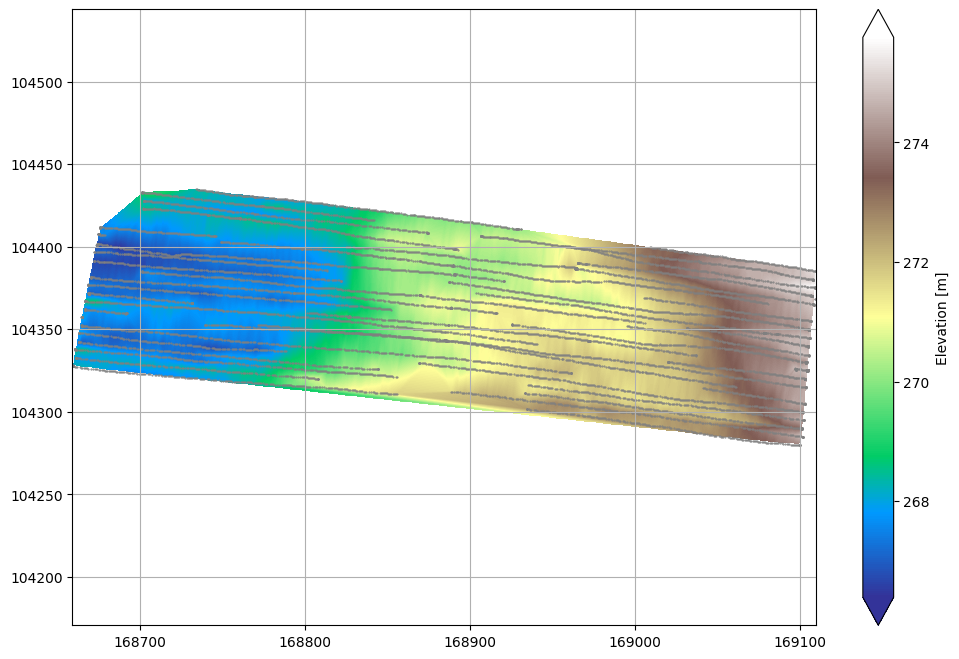
Interpolate values on a structured grid
set interpolation grid extent and limit values for representation in plots
[5]:
extent = [168650,169150,104250,104450]
vlim = [265, 275]
[6]:
fig, ax = plt.subplots(figsize=(12,8))
v, im = interpolate_xyv(gdf, col='Elevation', ax=ax, plot=True, cmap='terrain')
gdf.plot(ax=ax, markersize=0.25, color='grey', legend=False)
fig.colorbar(im, extend='both', label='Elevation [m]')
ax.grid('on')
Interpolate values on an unstructured grid
Randomly sample the points where to interpolate the data
[7]:
n_samples = 100
xy=np.vstack([np.random.uniform(extent[0], extent[1], n_samples), np.random.uniform(extent[2], extent[3], n_samples)]).T
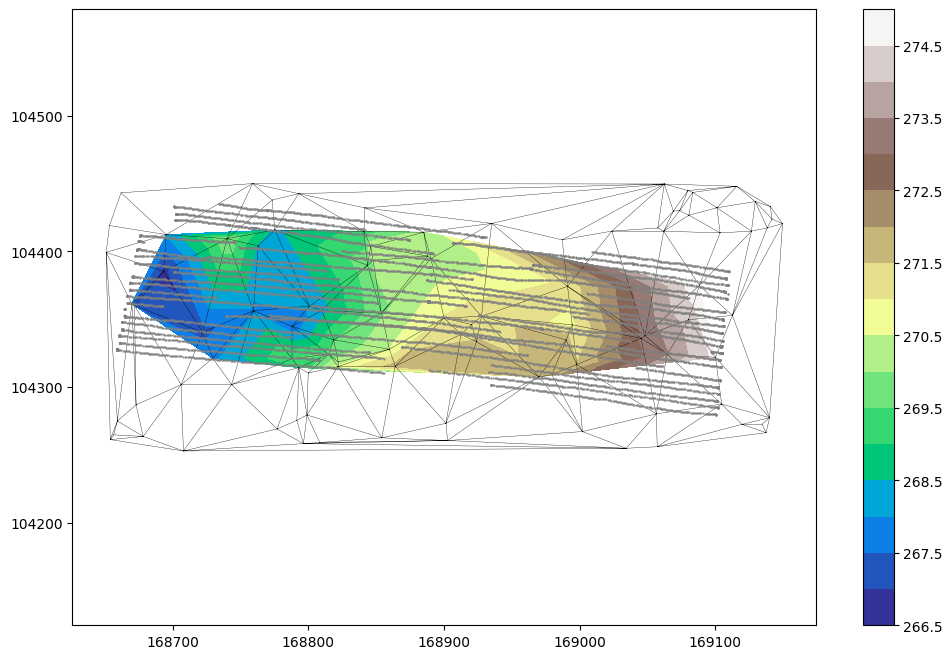
Interpolate and display the interpolated map with the triangulation
[8]:
_, ax = plt.subplots(figsize=(12,8))
v_tri, im = interpolate_xyv(gdf, col='Elevation', xy=xy, ax=ax, levels= 16, cmap='terrain')
ax.triplot(xy[:,0], xy[:,1], color='black', linewidth=0.25)
gdf.plot(ax=ax, markersize=0.25, color='grey', legend=False)
fig.colorbar(im, ax=ax)
/tmp/ipykernel_184854/189992380.py:5: UserWarning: Adding colorbar to a different Figure <Figure size 1200x800 with 2 Axes> than <Figure size 1200x800 with 2 Axes> which fig.colorbar is called on.
  fig.colorbar(im, ax=ax)
[8]:
<matplotlib.colorbar.Colorbar at 0x77d4d8f381c0>