Interpolate elevation along a profile
Kaufmann, 2017-2023.
[1]:
import matplotlib.pyplot as plt
from geometron.geometries import cclength2xz
import numpy as np
Create a list of lists of points along the profile
The list is written like this : [[distance on the horizontal plane, elevation], …].
It can be derived from a on a map using intersections of the profile with elevation contours.
Warning horizontal distances should be unique (no vertical…)
[2]:
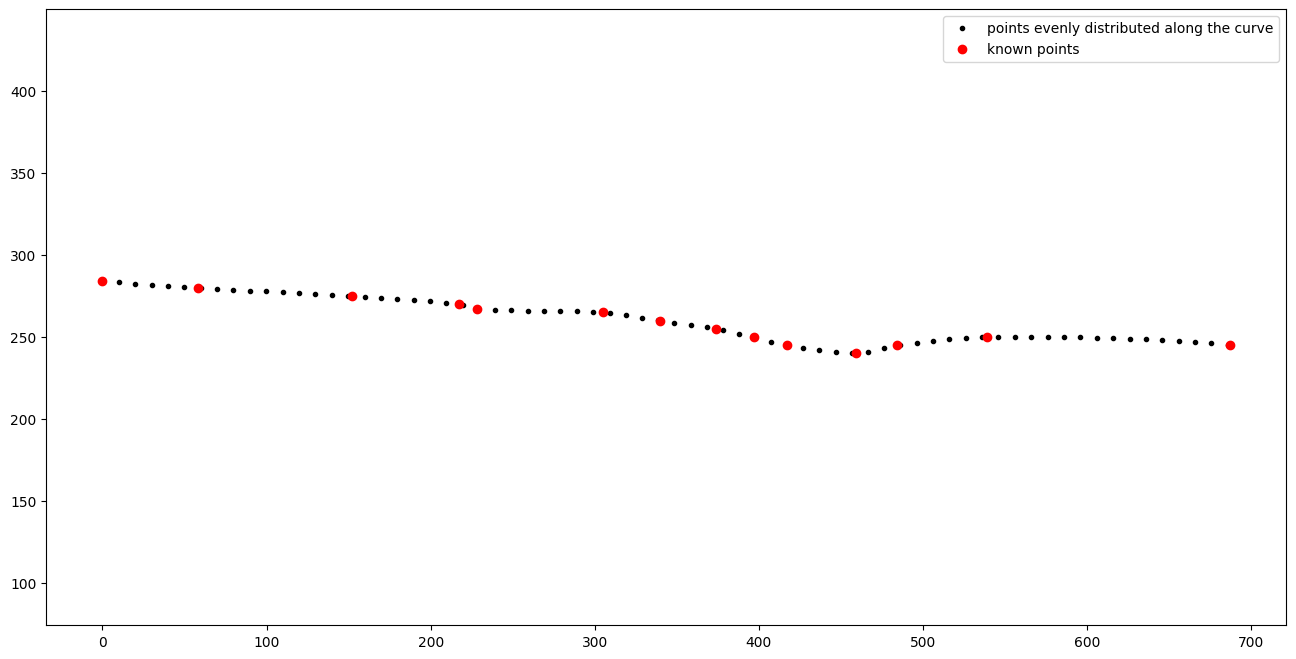
known_points=[[0,284],[58,280],[152,275],[217,270],[228,267],[305,265],[340,260], [374,255], [397,250], [417,245], [459, 240], [484, 245], [539, 250], [687, 245]]
Compute the length of a curve from known points using pchip approximation
[3]:
xz = cclength2xz(known_points, np.linspace(0,800,81))
Elevation of points evenly distributed along the profile
[4]:
fig, ax = plt.subplots(figsize=(16,8))
ax.plot(xz.T[0], xz.T[1], '.k', label='points evenly distributed along the curve')
ax.plot(np.array(known_points).T[0],np.array(known_points).T[1], 'or', label='known points')
ax.axis('equal')
ax.legend()
[4]:
<matplotlib.legend.Legend at 0x7182daf46da0>