Topo - VTK 4x4 transform matrix from control points
Kaufmann, 2021.
[1]:
from ipywidgets import TwoByTwoLayout
import bootsoff.topo.geometry as btg
import pyvista as pv
import numpy as np
Coordinates of the control points in the origin space
at least 4 non co-planar points are required, if more than 4 are given, a least-squares approach is used
[2]:
p0 = np.array([0., 0., 0.])
p1 = np.array([0., 4., 0.])
p2 = np.array([1., 0., 0.])
p3 = np.array([0., 0., 2.])
[3]:
origin_points = [p0, p1, p2, p3]
Corresponding coordinates of the control points in the destination space
[4]:
P0 = np.array([2., 0., 0.])
P1 = np.array([2., 0., 1.])
P2 = np.array([3., 0., 0.])
P3 = np.array([2., -4., 3.])
[5]:
destination_points = [P0, P1, P2, P3]
Convert control points to vtk objects
[6]:
origin = pv.PolyData(origin_points)
origin['Labels'] = [f'p{i}' for i in range(4)]
destination = pv.PolyData(destination_points)
destination['Labels'] = [f'P{i}' for i in range(4)]
2021-10-03 19:10:02.006 (   0.254s) [        513FF740]vtkDataSetAttributes.cx:1285  WARN| vtkPointData (0x5561511ae700): Can not set attribute Scalars. Only vtkDataArray subclasses can be set as active attributes.
2021-10-03 19:10:02.008 (   0.256s) [        513FF740]vtkDataSetAttributes.cx:1285  WARN| vtkPointData (0x55615130eca0): Can not set attribute Scalars. Only vtkDataArray subclasses can be set as active attributes.
Create plotters for the origin and destination spaces
[7]:
origin_plotter = pv.Plotter()
origin_plotter.add_point_labels(origin, 'Labels', point_size=12, font_size=12, point_color='green')
#origin_plotter.add_points(origin, point_size=12, color='green')
origin_plotter.add_axes_at_origin(labels_off=True)
origin_plotter.camera_position = 'iso'
# origin_plotter.show_grid()
origin_scene = origin_plotter.show(jupyter_backend='ipyvtklink', return_viewer=True)
[8]:
destination_plotter = pv.Plotter()
destination_plotter.add_point_labels(destination, 'Labels', point_size=12, font_size=12, point_color='orange')
destination_plotter.add_axes_at_origin(labels_off=True)
destination_plotter.camera_position = 'iso'
# destination_plotter.show_grid()
destination_scene = destination_plotter.show(jupyter_backend='ipyvtklink', return_viewer=True)
Compute the 4x4 transform matrix
[9]:
transform_matrix, _ = btg.vtk_transform_matrix_from_control_points(origin_points, destination_points)
Use the 4x4 transform to transform origin points into destination points
[10]:
origin_copy = origin.copy()
2021-10-03 19:10:02.577 ( 0.825s) [ 513FF740]vtkDataSetAttributes.cx:1285 WARN| vtkPointData (0x5561511ae700): Can not set attribute Scalars. Only vtkDataArray subclasses can be set as active attributes.
[11]:
origin_copy.clear_arrays() # must remove field before applying transform
transformed = origin_copy.transform(transform_matrix)
[12]:
transformed['Labels'] = [f'P{i}' for i in range(4)]
2021-10-03 19:10:02.591 ( 0.839s) [ 513FF740]vtkDataSetAttributes.cx:1285 WARN| vtkPointData (0x556152280070): Can not set attribute Scalars. Only vtkDataArray subclasses can be set as active attributes.
[13]:
transformed
2021-10-03 19:10:02.599 ( 0.847s) [ 513FF740]vtkDataSetAttributes.cx:1285 WARN| vtkPointData (0x556152280070): Can not set attribute Scalars. Only vtkDataArray subclasses can be set as active attributes.
[13]:
| Header | Data Arrays | ||||||||||||||||||||||||||
|---|---|---|---|---|---|---|---|---|---|---|---|---|---|---|---|---|---|---|---|---|---|---|---|---|---|---|---|
|
|
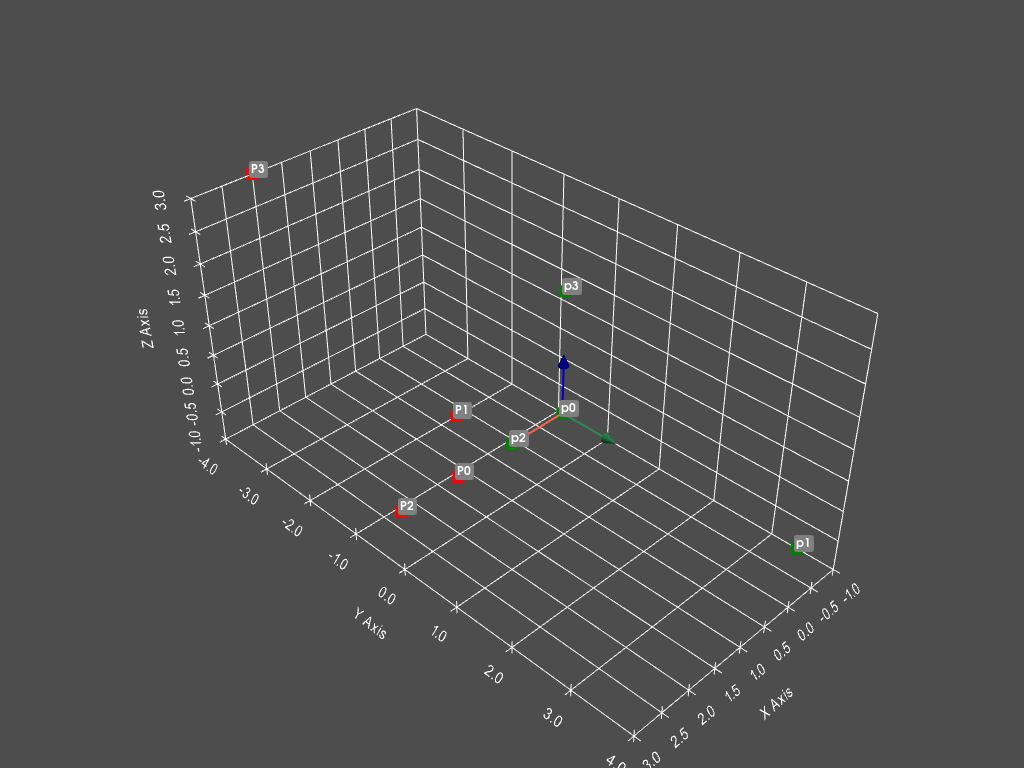
Create a plotter for transformed points and display origin (top left), destination (top right) end transformed (bottom right) control points
[14]:
transformed_plotter = pv.Plotter()
transformed_plotter.add_point_labels(transformed, 'Labels', point_size=12, font_size=12, point_color='red')
#transformed_plotter.add_points(transformed, point_size=12, color='green')
transformed_plotter.add_axes_at_origin(labels_off=True)
transformed_plotter.camera_position = 'iso'
#transformed_plotter.show_grid()
transformed_scene = transformed_plotter.show(jupyter_backend='ipyvtklink', return_viewer=True)
[15]:
TwoByTwoLayout(top_left=origin_scene, top_right=destination_scene, bottom_right=transformed_scene)
[16]:
static_plotter = pv.Plotter()
static_plotter.add_point_labels(transformed, 'Labels', point_size=12, font_size=12, point_color='red')
static_plotter.add_point_labels(origin, 'Labels', point_size=12, font_size=12, point_color='green')
static_plotter.add_axes_at_origin(labels_off=True)
static_plotter.camera_position = 'iso'
static_plotter.show_grid()
static_plotter.show(jupyter_backend='static')

[17]:
[transformed.cell_points(i) for i in range(transformed.n_cells)]
[17]:
[array([[ 2.00000000e+00, -1.69891899e-16, -3.88578059e-16]]),
 array([[ 2.00000000e+00, -1.05807032e-15,  1.00000000e+00]]),
 array([[ 3.00000000e+00,  1.44942688e-16, -2.61544505e-16]]),
 array([[ 2., -4.,  3.]])]
[18]:
[destination.cell_points(i) for i in range(destination.n_cells)]
[18]:
[array([[2., 0., 0.]]),
 array([[2., 0., 1.]]),
 array([[3., 0., 0.]]),
 array([[ 2., -4.,  3.]])]