Topo - Concatenate two layers stored in geopackages
O.Kaufmann, 2021.
[1]:
import matplotlib.pyplot as plt
import geopandas as gpd
import pandas as pd
Read the layers into geodataframes
[2]:
gdf_2 = gpd.read_file('./data_gis/ft2.gpkg', layer='landmarks')
[3]:
gdf_3 = gpd.read_file('./data_gis/ft3.gpkg', layer='landmarks')
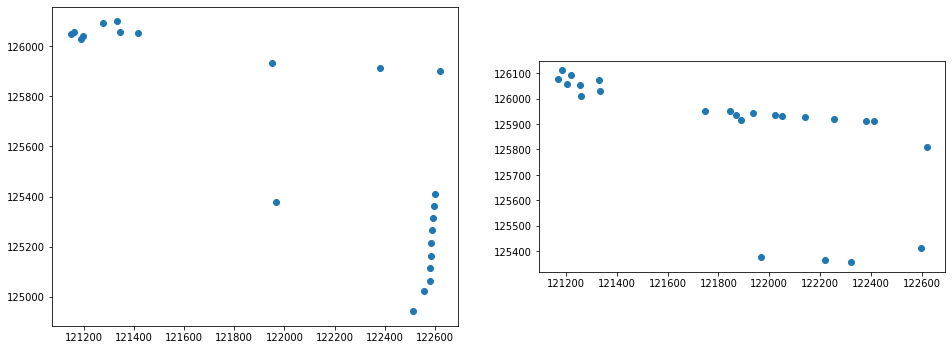
Plot the two layers in separate axes
[4]:
fig, ax = plt.subplots(ncols=2, figsize=(16,8))
gdf_2.plot(ax=ax[0])
gdf_3.plot(ax=ax[1])
[4]:
<AxesSubplot:>
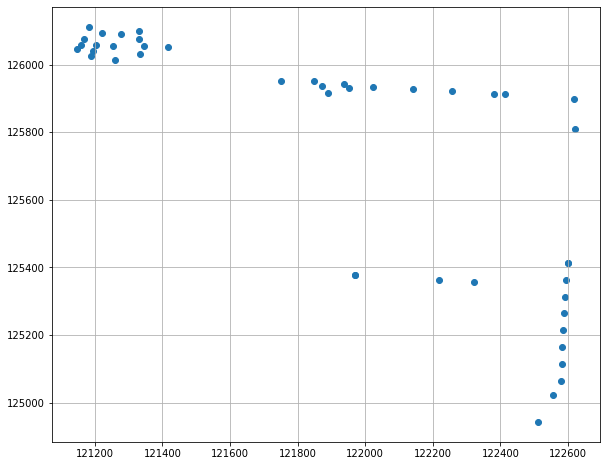
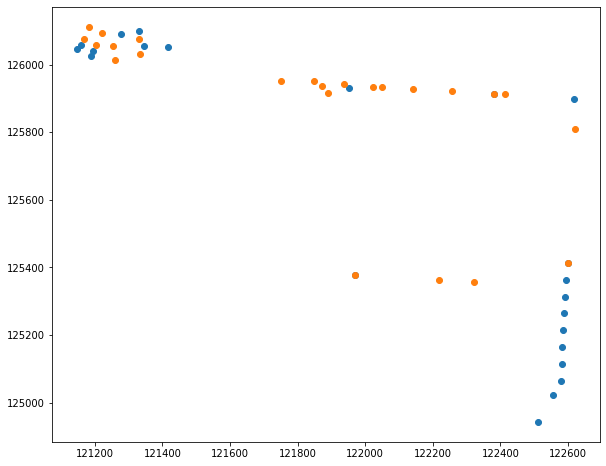
Plot the two layers in the same axis
[5]:
fig, ax = plt.subplots(figsize=(16,8))
gdf_2.plot(ax=ax)
gdf_3.plot(ax=ax)
[5]:
<AxesSubplot:>
[6]:
gdf_2.query('landmark=="L045"')
[6]:
| landmark | positioning | year | geometry | |
|---|---|---|---|---|
| 4 | L045 | GPS | 2021 | POINT (122583.565 125163.235) |
Clean the second layer and fix the landmark name
[7]:
gdf_3.dropna(axis='index', inplace=True)
[8]:
gdf_3['landmark'] = gdf_3['landmark'].apply(lambda x: f'L{x}')
[9]:
gdf_3
[9]:
| landmark | positioning | year | geometry | |
|---|---|---|---|---|
| 0 | L001 | GPS | 2021.0 | POINT (121184.037 126112.105) |
| 1 | L002 | GPS | 2021.0 | POINT (121219.870 126094.263) |
| 2 | L003 | GPS | 2021.0 | POINT (121203.004 126058.071) |
| 3 | L004 | GPS | 2021.0 | POINT (121167.300 126075.999) |
| 4 | L050 | GPS | 2021.0 | POINT (122599.237 125412.080) |
| 5 | L009 | GPS | 2021.0 | POINT (122619.580 125809.708) |
| 6 | L090 | GPS | 2021.0 | POINT (121890.166 125914.780) |
| 7 | L091 | GPS | 2021.0 | POINT (121871.364 125935.615) |
| 8 | L051 | GPS | 2021.0 | POINT (121968.549 125376.939) |
| 9 | L006 | GPS | 2021.0 | POINT (121258.614 126012.355) |
| 10 | L007 | GPS | 2021.0 | POINT (121254.530 126054.242) |
| 11 | L005 | GPS | 2021.0 | POINT (121332.472 126030.081) |
| 12 | L008 | GPS | 2021.0 | POINT (121331.031 126075.167) |
| 13 | L052 | GPS | 2021.0 | POINT (122217.941 125363.251) |
| 14 | L062 | GPS | 2021.0 | POINT (122322.165 125356.536) |
| 15 | L010 | GPS | 2021.0 | POINT (122021.498 125934.254) |
| 18 | L012 | GPS | 2021.0 | POINT (122256.704 125920.614) |
| 19 | L011 | GPS | 2021.0 | POINT (122141.663 125926.539) |
| 20 | L013 | GPS | 2021.0 | POINT (121749.332 125951.740) |
| 21 | L014 | GPS | 2021.0 | POINT (121846.951 125951.865) |
| 22 | L015 | GPS | 2021.0 | POINT (121936.764 125942.185) |
| 23 | L092 | \nLandmarks in space | 2021.0 | POINT (122414.240 125913.989) |
Concatenate the two layers
[10]:
gdf = pd.concat([gdf_2, gdf_3])
Check the crs
[11]:
gdf.crs
[11]:
<Projected CRS: EPSG:31370>
Name: Belge 1972 / Belgian Lambert 72
Axis Info [cartesian]:
- X[east]: Easting (metre)
- Y[north]: Northing (metre)
Area of Use:
- name: Belgium - onshore.
- bounds: (2.5, 49.5, 6.4, 51.51)
Coordinate Operation:
- name: Belgian Lambert 72
- method: Lambert Conic Conformal (2SP)
Datum: Reseau National Belge 1972
- Ellipsoid: International 1924
- Prime Meridian: Greenwich