Gravimetry - Simulate Earth Tides using tidegravity
KAUFMANN, 2019-2021.
[1]:
from datetime import datetime
from tidegravity import solve_point_corr
from matplotlib import pyplot as plt
import matplotlib.dates as mdates
[2]:
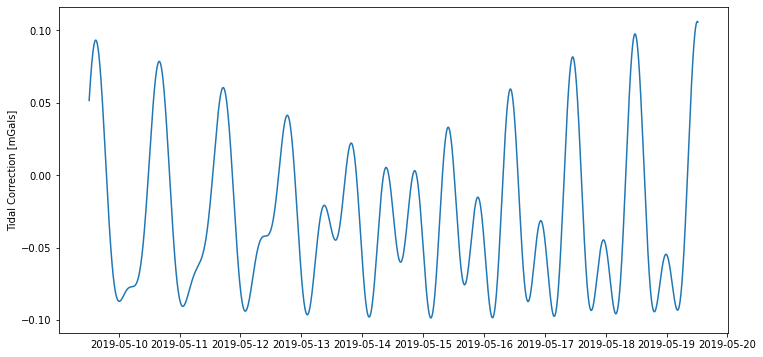
# Set location (lat, long) on INT,1924 or INT,1967 or any reasonable spheroid and time (utc)
lat = 50.445818
lon = 3.955923
# Note: West should be entered as a negative longitude value
alt = 74.96
t0 = datetime(2019, 5, 9, 12, 19, 56)
n_days = 10

# Calculate corrections for one day (60*60*24 points), with 1 second resolution
result_df = solve_point_corr(lat, lon, alt, t0, n=n_days*60*60*24, increment='S')

# Plot the corrections using matplotlib
fig, ax = plt.subplots(figsize=(12,6))
ax.plot(result_df['g0'])
ax.set_ylabel('Tidal Correction [mGals]')
#set ticks every day
ax.xaxis.set_major_locator(mdates.AutoDateLocator())
#set major ticks format
ax.xaxis.set_major_formatter(mdates.AutoDateFormatter(ax.xaxis.get_major_locator()))
[3]:
result_df['g0'][0]
[3]:
0.051548775464031284