Topo - Interpolate elevation along a profile
O.KAUFMANN, 2017-2021.
[1]:
import matplotlib.pyplot as plt
from bootsoff.topo import cclength2xz
import numpy as np
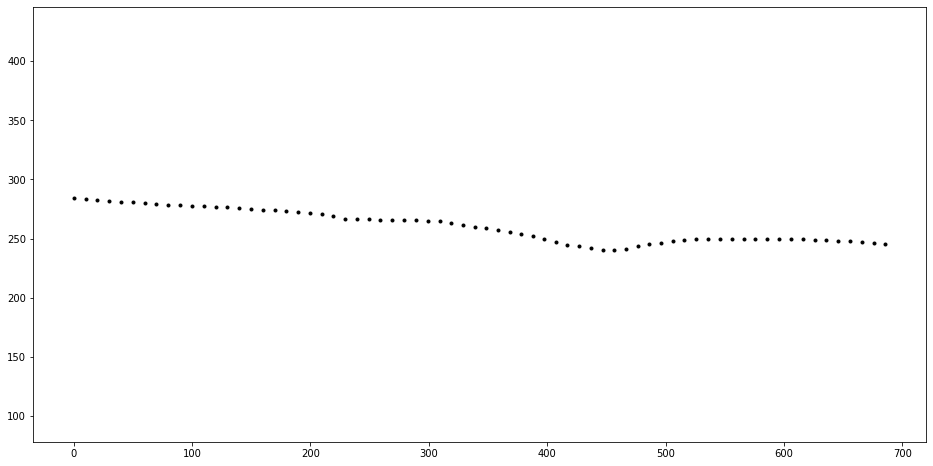
Create a list of lists of points along the profile: [ [distance in the horizontal plane, elevation], …]
Warning horizontal distances should be unique (no vertical…)
[2]:
known_points=[[0,284],[58,280],[152,275],[217,270],[228,267],[305,265],[340,260], [374,255], [397,250], [417,245], [459, 240], [484, 245], [539, 250], [687, 245]]
Functions to compute y the length of a curve know on some points and approximated by a pchip interpolation
[3]:
xz = cclength2xz(known_points, np.linspace(0,800,81))
[4]:
xz
[4]:
array([[  0.        , 284.        ],
       [  9.97253064, 283.25931495],
       [ 19.94629336, 282.53541753],
       [ 29.92154257, 281.83231027],
       [ 39.89850799, 281.15400302],
       [ 49.87738991, 280.50451399],
       [ 59.85837142, 279.88815605],
       [ 69.84197817, 279.3159463 ],
       [ 79.82776754, 278.78310727],
       [ 89.81498055, 278.27759958],
       [ 99.80295624, 277.78736039],
       [109.79108847, 277.30031458],
       [119.77878263, 276.80438453],
       [129.76541214, 276.28749963],
       [139.75027518, 275.73760657],
       [149.73255179, 275.14268156],
       [159.71411277, 274.53600751],
       [169.69857889, 273.97887543],
       [179.68225742, 273.40794058],
       [189.66089765, 272.75554312],
       [199.6286241 , 271.95451449],
       [209.57664963, 270.93881775],
       [219.45165788, 269.43989926],
       [229.08100381, 266.93673223],
       [239.06986352, 266.46832175],
       [249.06532314, 266.16981957],
       [259.06358479, 265.98502175],
       [269.06276711, 265.85743378],
       [279.06195771, 265.73047277],
       [289.06025483, 265.54755504],
       [299.05580888, 265.25218258],
       [309.04069551, 264.72313319],
       [318.96262601, 263.4902004 ],
       [328.82488899, 261.83731827],
       [338.68876778, 260.19432586],
       [348.59052551, 258.79647648],
       [358.49649479, 257.42841794],
       [368.3859974 , 255.94691317],
       [378.23195823, 254.20188996],
       [388.00650659, 252.09207509],
       [397.74569449, 249.82318437],
       [407.40263175, 247.22823465],
       [417.14117934, 244.97622199],
       [427.00090457, 243.30717793],
       [436.88197136, 241.77117083],
       [446.81172038, 240.59615684],
       [456.79299956, 240.02146908],
       [466.72380629, 240.92060552],
       [476.40676846, 243.4136496 ],
       [486.21854151, 245.29170693],
       [496.13398569, 246.58934359],
       [506.05967858, 247.80555852],
       [516.0055409 , 248.84257403],
       [525.97632764, 249.60038083],
       [535.96845712, 249.97680935],
       [545.96833941, 249.99947812],
       [555.96833643, 249.99246466],
       [565.9683089 , 249.96974856],
       [575.96819162, 249.92207632],
       [585.96785011, 249.84019627],
       [595.96705499, 249.7148613 ],
       [605.96545647, 249.53683327],
       [615.96255896, 249.29688987],
       [625.95769609, 248.98583427],
       [635.95000628, 248.59450798],
       [645.93840908, 248.1138075 ],
       [655.92158267, 247.53470489],
       [665.89794299, 246.84827291],
       [675.8656249 , 246.04571459],
       [685.82246597, 245.11839764],
       [         nan,          nan],
       [         nan,          nan],
       [         nan,          nan],
       [         nan,          nan],
       [         nan,          nan],
       [         nan,          nan],
       [         nan,          nan],
       [         nan,          nan],
       [         nan,          nan],
       [         nan,          nan],
       [         nan,          nan]])
[5]:
plt.figure(figsize=(16,8))
plt.plot(xz.T[0], xz.T[1], '.k')
plt.axis('equal')
[5]:
(-34.29112329846765, 720.1135892678208, 237.82254253877488, 286.1989265457726)