Topo - Extract elevations from a DEM
O.KAUFMANN, 2021.
[1]:
import rasterio as rio
from rasterio.plot import show
import geopandas as gpd
import numpy as np
import matplotlib.pyplot as plt
from shapely.geometry import Point
from bootsoff.topo import topo
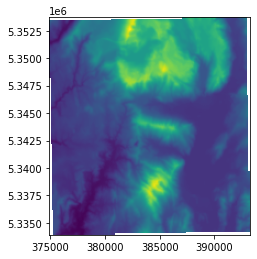
Read the DEM
[2]:
dem=rio.open('./data_gis/example_DEM_100m_srtm_mga55.asc')
[3]:
show(dem)
[3]:
<AxesSubplot:>
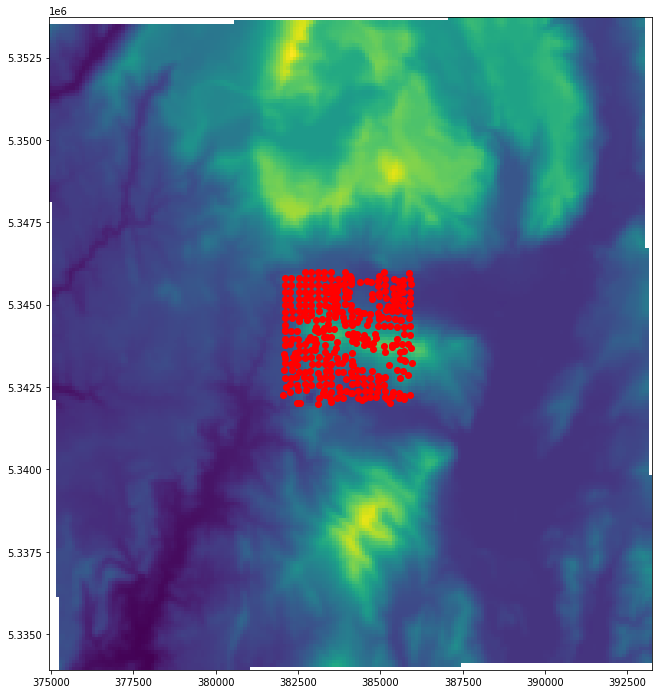
Get the stations form a geopackage layer
[4]:
stations = gpd.read_file('./data_gis/test.gpkg', layer='bouguer')
[5]:
fig, ax = plt.subplots(figsize=(12,12))
show(dem, ax=ax)
stations.plot(ax=ax, color='r', aspect=1)
[5]:
<AxesSubplot:>
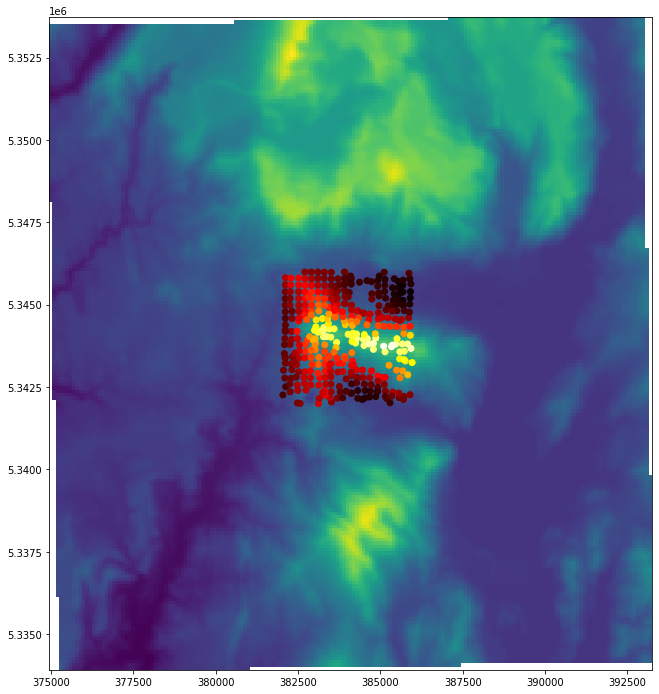
Extract elevations
[6]:
stations['Z'] = [i[0] for i in dem.sample(stations[['X', 'Y']].values)]
[7]:
stations.head()
[7]:
| X | Y | dg | geometry | Z | |
|---|---|---|---|---|---|
| 0 | 384302.181339 | 5.344813e+06 | -24.61 | POINT (384302.181 5344813.181) | 414.210938 |
| 1 | 384472.181705 | 5.344743e+06 | -24.64 | POINT (384472.182 5344743.181) | 398.322052 |
| 2 | 384672.182200 | 5.344713e+06 | -24.72 | POINT (384672.182 5344713.181) | 424.723907 |
| 3 | 384966.182873 | 5.344624e+06 | -25.42 | POINT (384966.183 5344624.180) | 401.536011 |
| 4 | 384742.183147 | 5.345333e+06 | -24.14 | POINT (384742.183 5345333.182) | 314.284149 |
[8]:
fig, ax = plt.subplots(figsize=(12,12))
show(dem, ax=ax)
stations.plot(column='Z', ax=ax, cmap='hot', aspect=1)
[8]:
<AxesSubplot:>