Display a raster image as a vertical plane section in 3D
Kaufmann, 2024.
[1]:
import numpy as np
import pyvista as pv
import pandas as pd
import geopandas as gpd
from geometron.geometries.transforms import affine_transform_matrix
from geometron.vtk import map_image_to_plane
from shapely.geometry import Point
Define the 2D transform between the local coordinates and the LB72 CRS
[2]:
df = pd.read_csv('./data/Reunis_plans_georef.txt')
df
[2]:
| XL | YL | ZL | Xlocal | Ylocal | Zlocal | |
|---|---|---|---|---|---|---|
| 0 | 156048 | 122997 | 0 | 2500.0 | -2700 | 0 |
| 1 | 154908 | 121515 | 0 | 1300.0 | -4200 | 0 |
| 2 | 155975 | 122989 | 0 | 2427.5 | -2709 | 0 |
| 3 | 155975 | 122989 | -1000 | 2427.5 | -2709 | -1000 |
[3]:
origin_coords = [Point([r.Xlocal, r.Ylocal, r.Zlocal]) for idx, r in df.iterrows()]
destination_coords = [Point([r.XL, r.YL, r.ZL]) for idx, r in df.iterrows()]
[4]:
local_to_lb72_transform_matrix, residuals, _, _ = affine_transform_matrix(origin_coords, destination_coords, shapely_format=False)
print(local_to_lb72_transform_matrix)
[[ 1.01316998e+00 -5.05359877e-02 -1.11022302e-14  1.53378628e+05]
 [-1.36600306e-02  9.98928025e-01 -2.30926389e-14  1.25728256e+05]
 [ 1.52626127e-15 -1.40165657e-15  1.00000000e+00 -7.65607717e-12]
 [ 0.00000000e+00  0.00000000e+00  0.00000000e+00  1.00000000e+00]]
Read the section image and warp it to a plane in local coordinates
Define the transform between the image coordinates and the local coordinates
[5]:
df = pd.read_csv(f'./data/Reunis-Puits12-01_resampled.txt')
df
[5]:
| Ximage | Yimage | Zimage | Xlocal | Ylocal | Zlocal | |
|---|---|---|---|---|---|---|
| 0 | 0 | 149 | 665 | 2427.5 | -3100 | -300 |
| 1 | 0 | 1078 | 133 | 2427.5 | -2400 | 100 |
[6]:
cx = 0.
cy = (df.loc[0,'Ylocal']-df.loc[1,'Ylocal'])/(df.loc[0,'Yimage']-df.loc[1,'Yimage'])
cz = (df.loc[0,'Zlocal']-df.loc[1,'Zlocal'])/(df.loc[0,'Zimage']-df.loc[1,'Zimage'])
tx = df.loc[0,'Xlocal']
ty = df.loc[0,'Ylocal'] - cy * df.loc[0,'Yimage']
tz = df.loc[0,'Zlocal'] - cz * df.loc[0,'Zimage']
[7]:
image_to_local_transform_matrix= np.array([[0., 0., 0., tx],
                                           [cy, 0., 0., ty],
                                           [0., cz, 0., tz],
                                           [0., 0., 0., 1.]])
Create the section plane and texture
[8]:
section_plane, image = map_image_to_plane('./data/Reunis-Puits12-01_resampled.png', image_to_local_transform_matrix)
Transform the section plane into LB72 coordinates
[9]:
section_plane.transform(local_to_lb72_transform_matrix);
Add shafts with coordinates in LB72
[10]:
shaft_P1 = pv.Line(pointa=(156220., 123391., 150.), pointb=(156220.,123391.,-400.), resolution=1).tube(radius=5.)
shaft_P12 = pv.Line(pointa=(155975., 122989., 150.), pointb=(155975., 122989., -400.), resolution=1).tube(radius=5.)
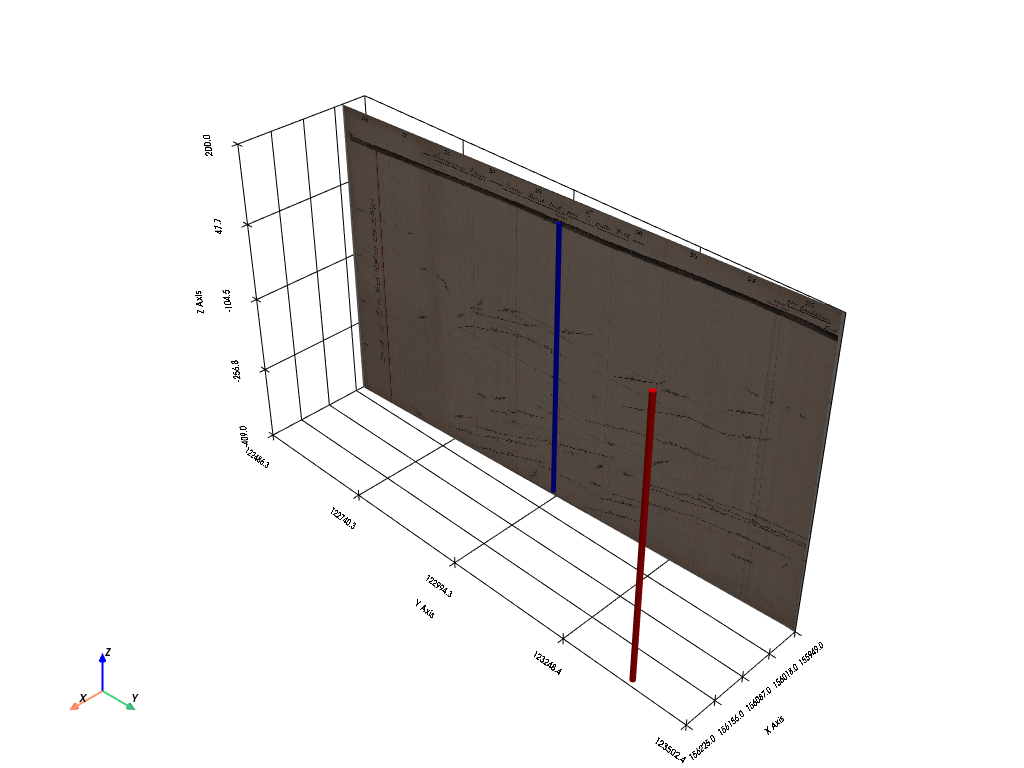
Display section and shafts together
[11]:
p = pv.Plotter()
p.add_mesh(section_plane, texture=image)
p.add_mesh(shaft_P1, color='r')
p.add_mesh(shaft_P12, color='b')
p.add_axes()
p.show_grid(font_size=7)
p.show(jupyter_backend='static')