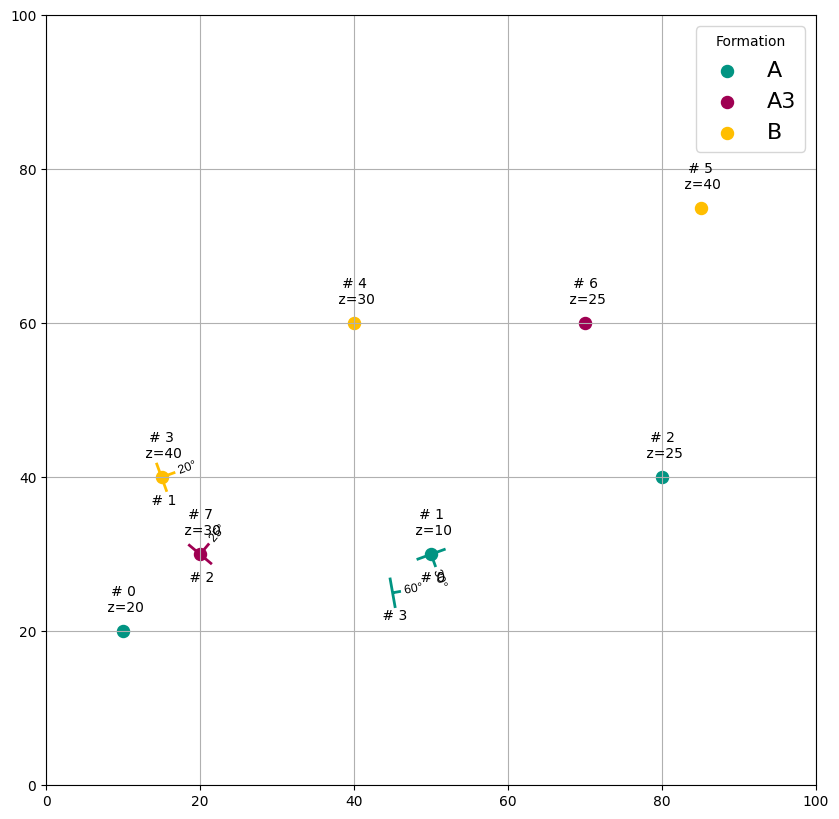
Plot a map with geological observation points
Kaufmann, 2021.
[1]:
from geometron.plot import geological_maps as gm
import matplotlib.pyplot as plt
import numpy as np
import pandas as pd
import geopandas as gpd
Create some observations consisting in surface points and orientations
[2]:
df_surface_points = pd.DataFrame.from_dict({'id': {0: 1, 1: 2, 2: 3, 3: 4, 4: 5, 5: 6, 6: 7, 7: 8},
                                            'X': {0: 10, 1: 50, 2: 80, 3: 15, 4: 40, 5: 85, 6: 70, 7: 20},
                                            'Y': {0: 20, 1: 30, 2: 40, 3: 40, 4: 60, 5: 75, 6: 60, 7: 30},
                                            'Z': {0: 20, 1: 10, 2: 25, 3: 40, 4: 30, 5: 40, 6: 25, 7: 30},
                                            'formation': {0: 'A', 1: 'A', 2: 'A', 3: 'B', 4: 'B', 5: 'B', 6: 'A3', 7: 'A3'},
                                            'order_series': {0: np.nan,  1: np.nan, 2: np.nan, 3: np.nan, 4: np.nan, 5: np.nan,
                                                             6: np.nan, 7: np.nan}})
[3]:
gdf_surface_points = gpd.GeoDataFrame(df_surface_points, geometry=gpd.points_from_xy(df_surface_points.X, df_surface_points.Y))
gdf_surface_points.crs = 'EPSG:32631'
[4]:
df_orientations = pd.DataFrame.from_dict({'id': {0: 2, 1: 4, 2: 8, 3: 9},
                              'X': {0: 50, 1: 15, 2: 20, 3: 45},
                              'Y': {0: 30, 1: 40, 2: 30, 3: 25},
                              'Z': {0: 10, 1: 40, 2: 30, 3: 12},
                              'azimuth': {0: 160, 1: 70, 2: 40, 3: 80},
                              'dip': {0: 30, 1: 20, 2: 25, 3: 60},
                              'polarity': {0: 1, 1: 1, 2: 1, 3: 1},
                              'formation': {0: 'A', 1: 'B', 2: 'A3', 3: 'A'},
                              'isFault': {0: False, 1: False, 2: False, 3: False},
                              'series': {0: 'Strat_Series_1', 1: 'Strat_Series_1', 2: 'Strat_Series_1  ', 3: 'Strat_Series_1'}})
[5]:
gdf_orientations = gpd.GeoDataFrame(df_orientations, geometry=gpd.points_from_xy(df_orientations.X, df_orientations.Y))
gdf_orientations.crs = 'EPSG:32631'
Define a color dictionary to associate a color with each formation
[6]:
color_dict = {'A': '#019482', 'A3': '#9f0052', 'B': '#ffbe00', 'basement': '#728f02'}
Display the map
[7]:
fig, ax = plt.subplots(figsize = (10,10))
gm.plot_observations(gdf_surface_points, gdf_orientations, color_dict=color_dict, ax=ax)
[7]:
<Axes: >