Plot a dip and strike symbol
Kaufmann, 2021.
[1]:
from geometron.plot import geological_maps as gm
import matplotlib.pyplot as plt
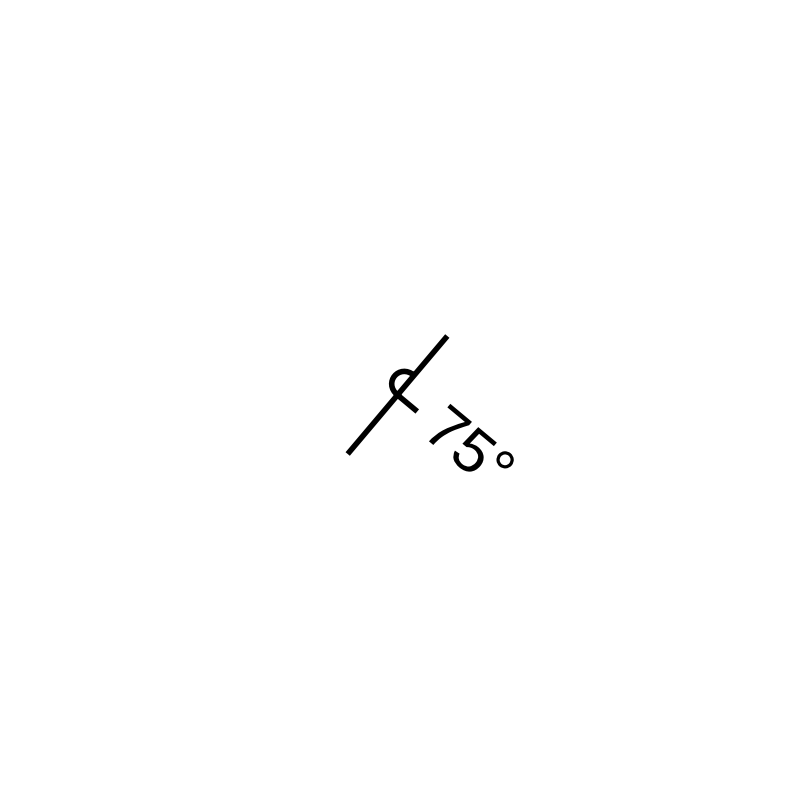
Build a symbol and associated text from an observation of dip and strike at xy
[2]:
symbol_patch, text_patch = gm.dip_and_strike_patch((0,0), dip=75, strike=40, polarity=0)
Display the symbol
[3]:
fig, ax = plt.subplots(figsize=(10,10))
ax.add_patch(symbol_patch)
if text_patch is not None:
    ax.add_patch(text_patch)
ax.set_xlim([-5,5])
ax.set_ylim([-5,5])
ax.axis('off')
[3]:
(-5.0, 5.0, -5.0, 5.0)