Plot a basemap
Kaufmann, 2021.
[1]:
from geometron.plot import plot_basemap
Define extent in EPSG:4326 coordinates (WGS84) and a cache directory for reusing downloaded tiles
[2]:
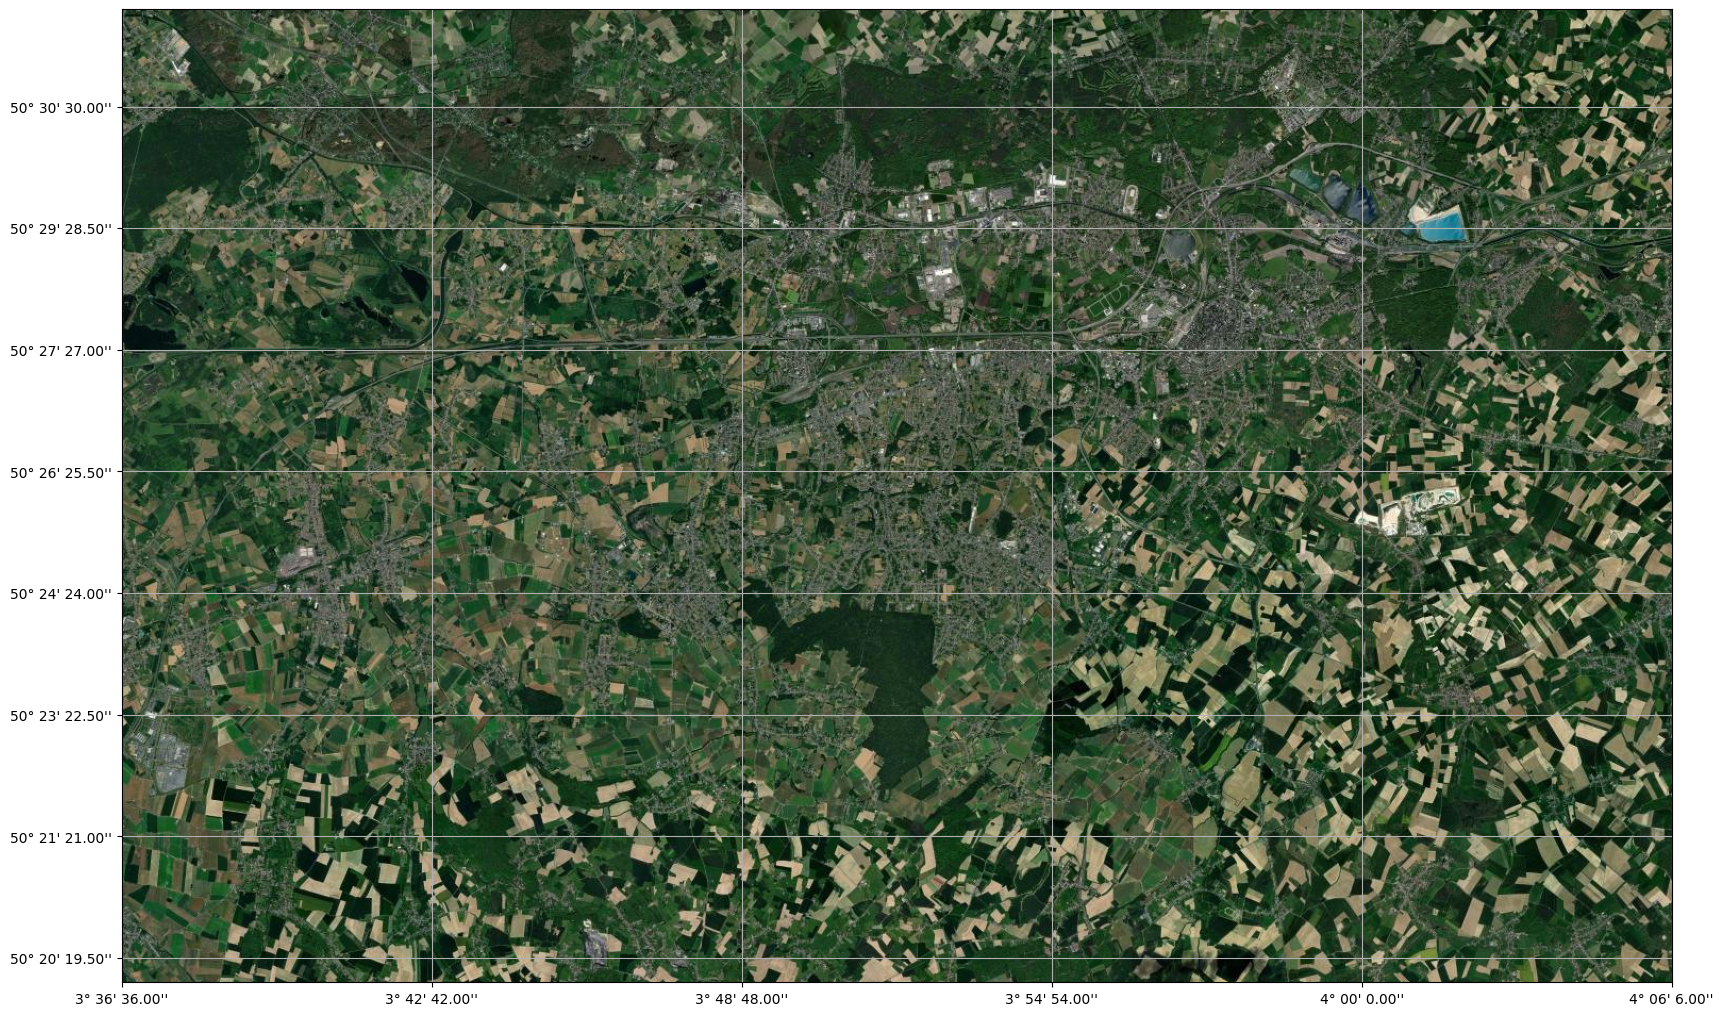
extent = (3.6, 4.1, 50.32, 50.52)
cache_dir = './tmp_files/.tiles_cache'
Plot the basemap in a matplotlib.pyplot axes
The defaut tile server and display parameters are used here…
[3]:
ax = plot_basemap(extent, figsize=(20,20), cache_dir=cache_dir)
When using a cache_dir images retrieved from the server are stored in a cache directory on your disk. If the same tile is needed again, the cached tile will be used. The process limits the number of requests to the servers and speeds-up the display.
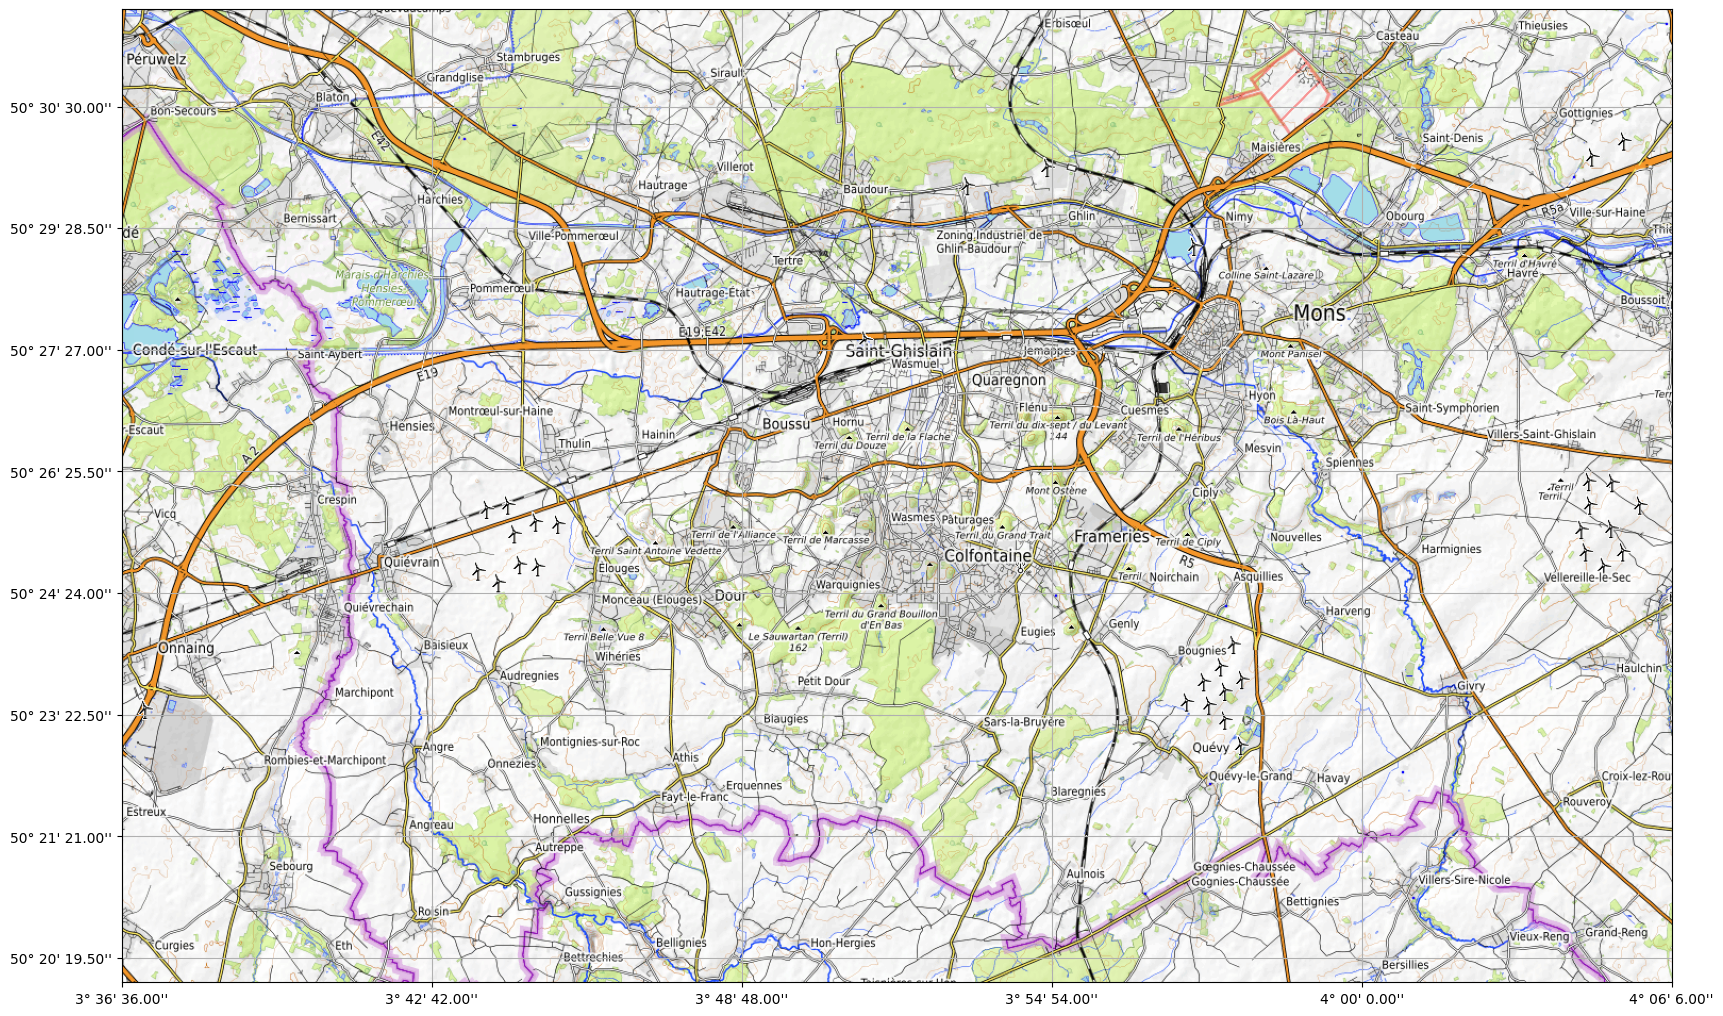
Several other named tile servers are available
[4]:
ax = plot_basemap(extent, figsize=(20,20), cache_dir=cache_dir, xyz_server='openstreetmap')
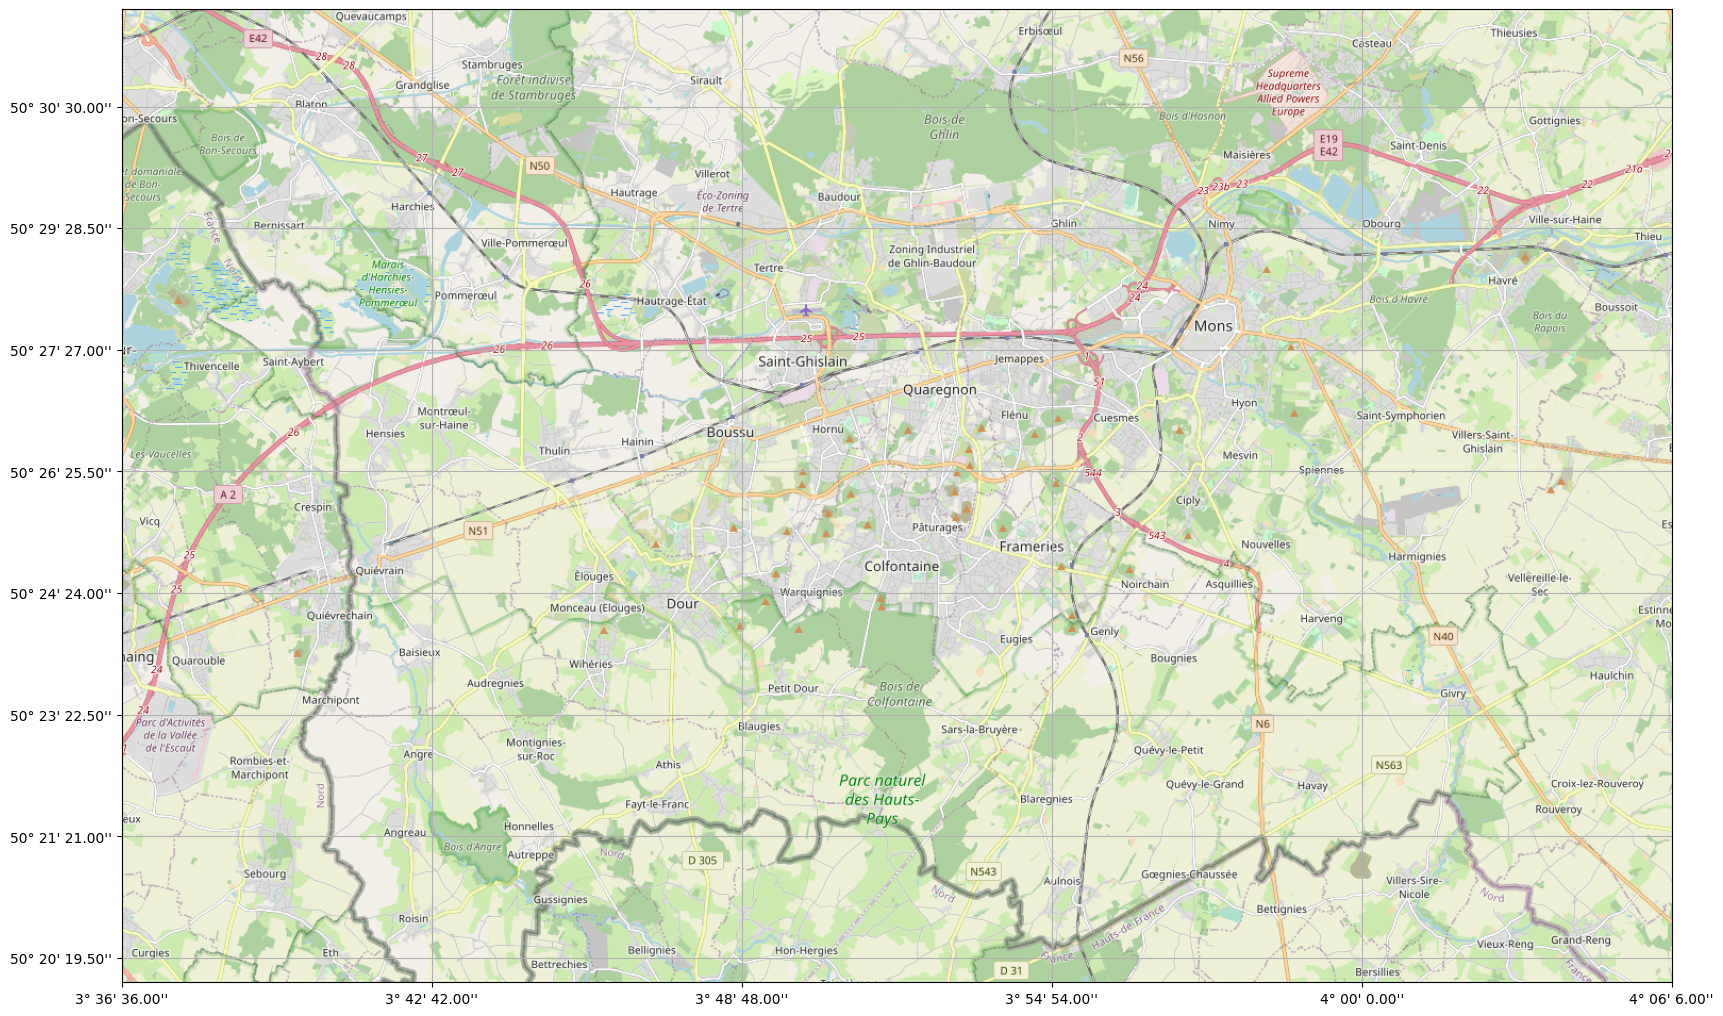
[5]:
ax = plot_basemap(extent, figsize=(20,20), cache_dir=cache_dir, xyz_server='google terrain')
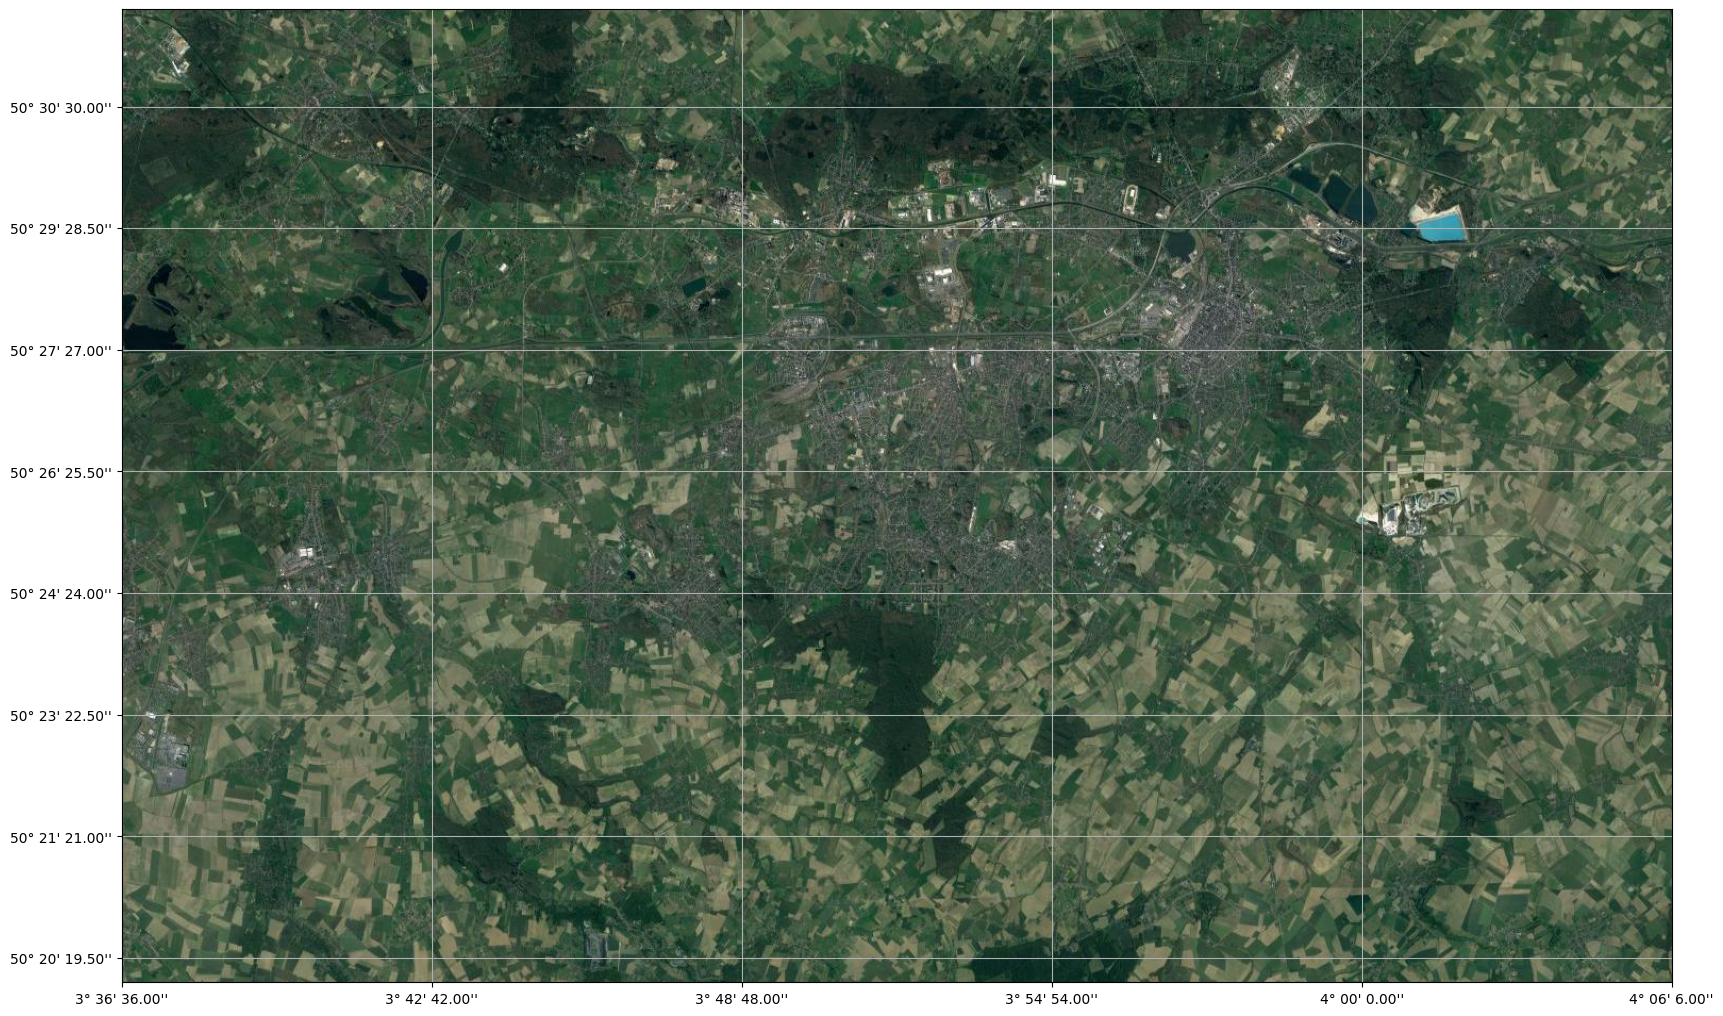
[6]:
ax = plot_basemap(extent, figsize=(20,20), cache_dir=cache_dir, xyz_server='esri world imagery')
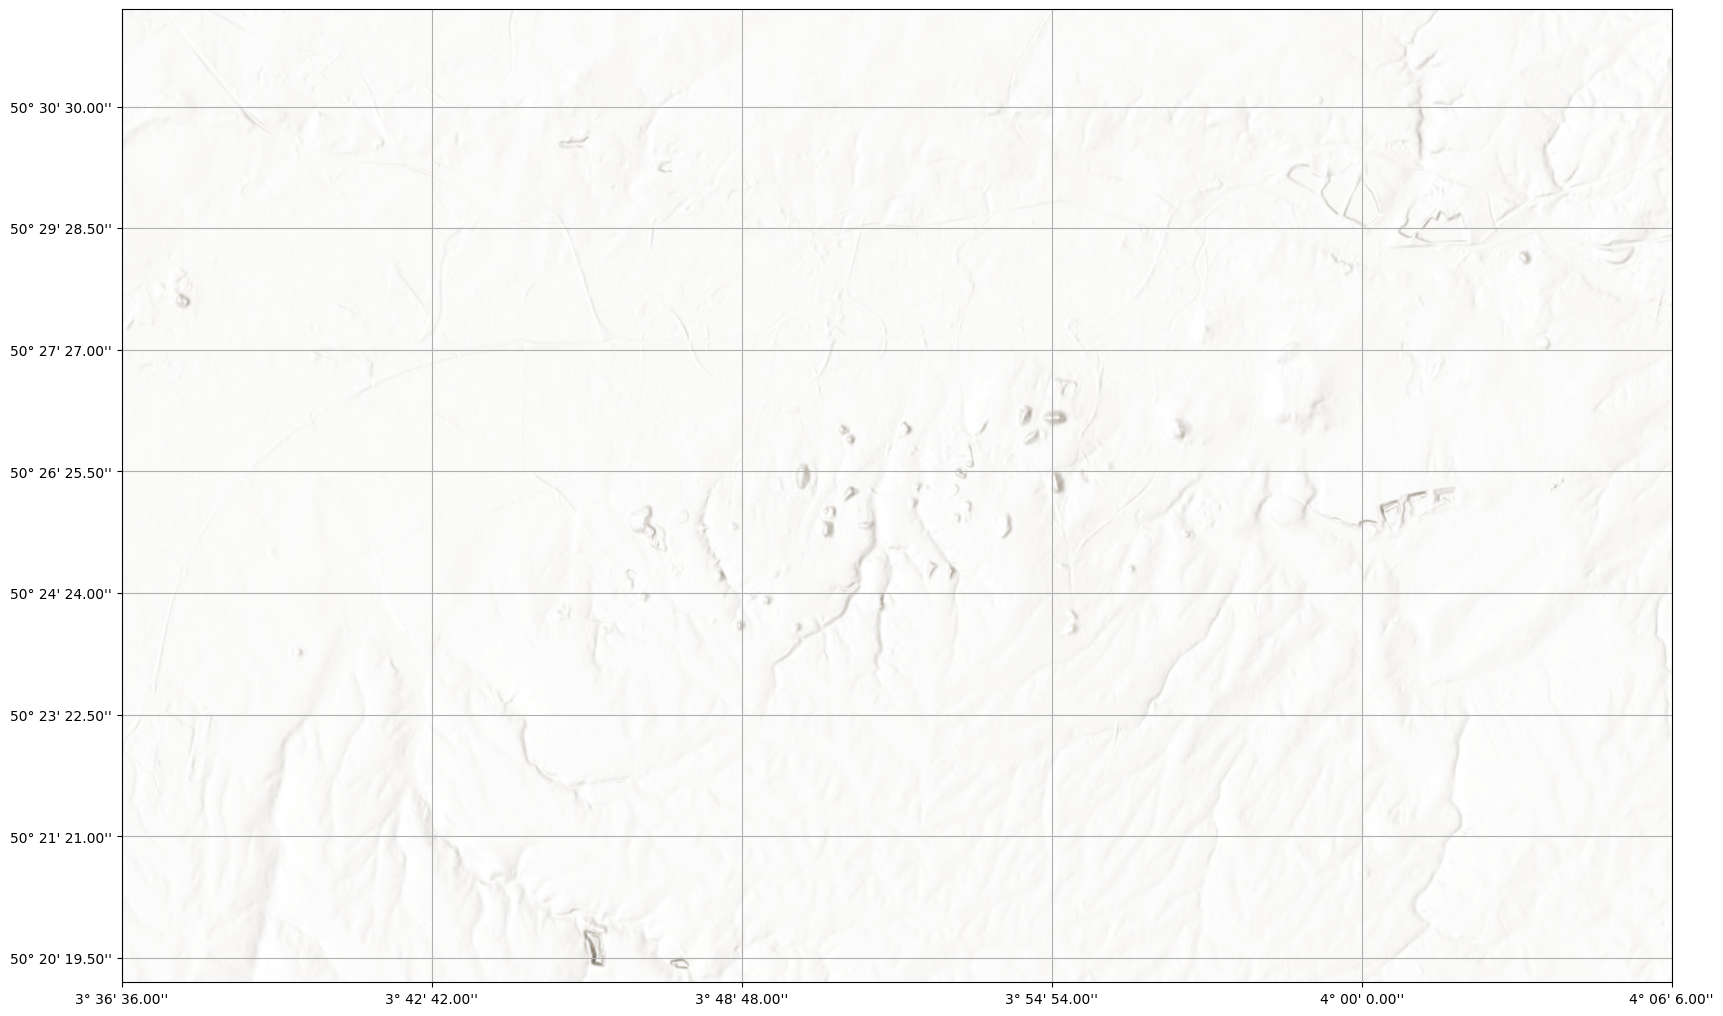
Extra xyz tile servers can also be used by providing the entire url
[7]:
ax = plot_basemap(extent, figsize=(20,20), cache_dir=cache_dir,
                  xyz_server='http://services.arcgisonline.com/ArcGIS/rest/services/Elevation/World_Hillshade/MapServer/tile/{z}/{y}/{x}')